Building telematics dashboards in Grafana with Navixy API
With telematics reshaping the fleet management landscape, data has evolved into the lifeblood of businesses, providing invaluable insights and boundless opportunities for optimization. However, the true power of data lies not just in its collection but in its visualization and analysis. This is where Grafana, an open-source visualization and analytics software, comes into play, unveiling new possibilities in the monitoring and understanding of telematics data.
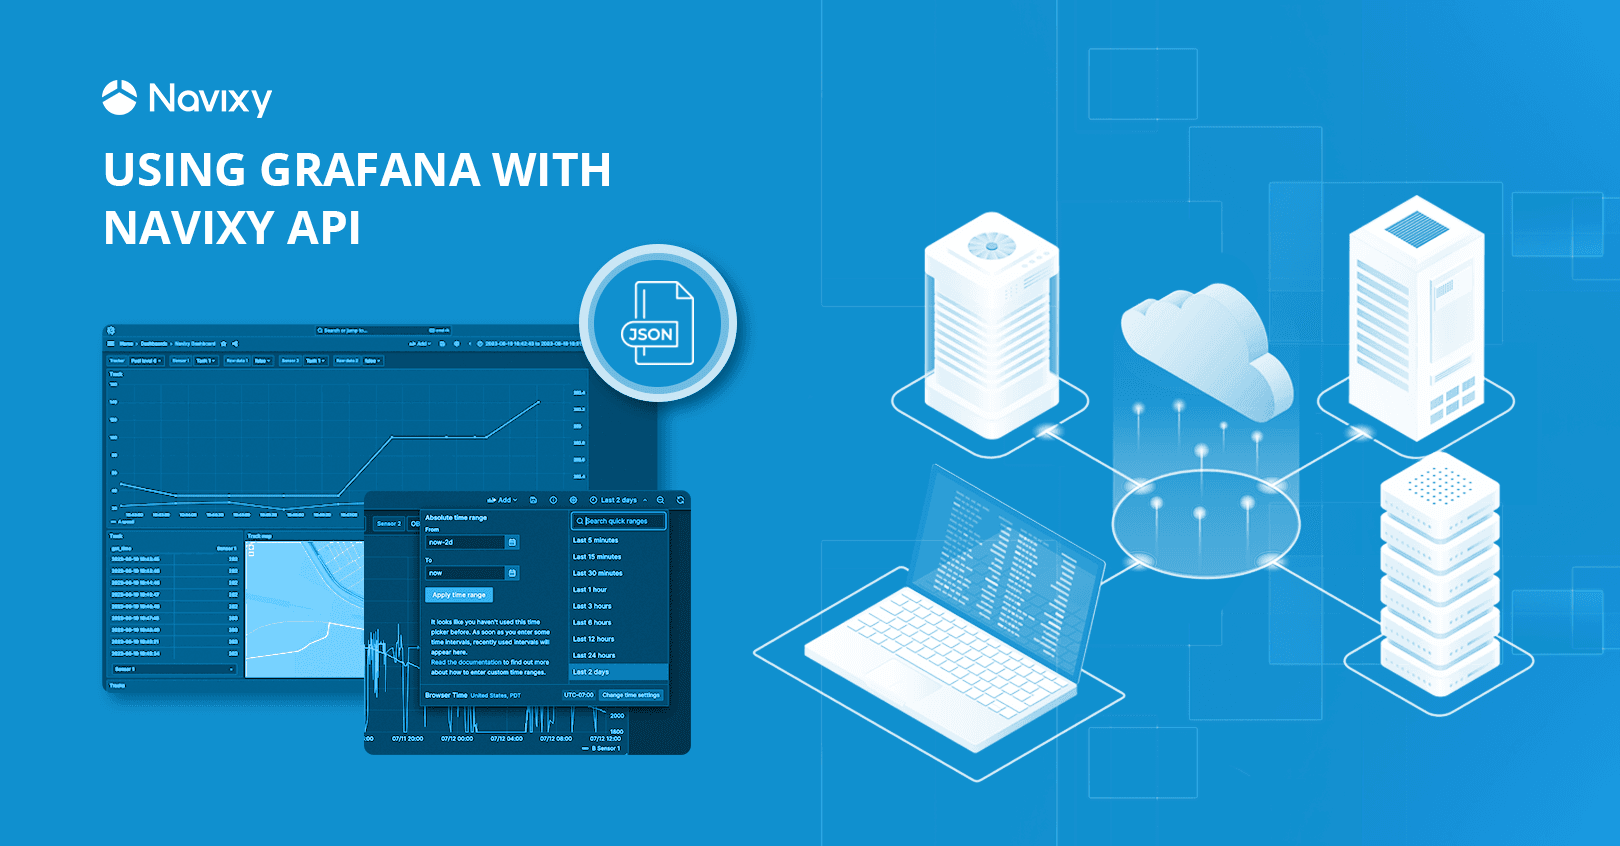
In this blog post, we will demonstrate how to integrate Grafana with Navixy and uncover the transformative potential of this powerful alliance in unlocking untapped data insights.
Benefits of integrating Navixy and Grafana for telematics professionals and business customers
The integration of Navixy and Grafana brings significant benefits to both telematics professionals and their business customers. For integrators, it facilitates the validation of GPS tracker and vehicle sensor configurations, enables issue diagnosis, and provides real-time performance monitoring. Grafana's robust visualization capabilities simplify the presentation of complex telematics data, empowering integrators to easily identify patterns, correlations, and anomalies that impact the accuracy and reliability of their projects.
Additionally, Grafana's capabilities extend to business customers who manage fleets. By embedding Grafana's dashboards directly into the Navixy interface, business users gain valuable insights from their data. This empowers customers to access crucial information pertaining to their fleet's performance, fuel consumption, and other essential metrics, enabling them to make informed decisions and optimize their fleet management practices.
Grafana's capabilities for IoT space
Grafana can serve as a hub for visualizing and analyzing vehicle telematics data from GPS trackers and vehicle sensors. Its popularity in the IoT space stems from its outstanding features for data visualization. One key feature is Grafana's seamless integration with APIs, which allows easy data retrieval from different sources. By connecting with platforms like Navixy, Grafana can extract real-time telematics data for visualization and analysis, empowering users to gain insights and make informed decisions.
Grafana offers a wide range of visualization options to cater to diverse data sets and analysis needs. Whether it's line charts, bar graphs, heatmaps, or tables, Grafana provides convenient visualizations that can be customized effortlessly. Users can adjust colors, labels, and styles to match their specific requirements and branding. Additionally, Grafana's interactive features, such as zooming, panning, and drill-down capabilities, enhance the exploration of data, enabling users to dig deeper and uncover valuable insights.
Connecting Navixy with Grafana: step-by-step guide
Following the steps below, you will have successfully connected Navixy with Grafana, enabling the visualization and analysis of your telematics data. The imported Navixy dashboard template will serve as a starting point, offering pre-configured visualizations and panels specific to your fleet data.

Step 1: Obtaining the Navixy API key
Start by logging into your Navixy account and navigating to the Account settings. Within the settings, locate the section for API keys and generate a unique API key. This key, such as "8f6a4353bc5114d97e2068b4e398", will be used to authenticate the connection between Navixy and Grafana.
Step 2: Launching Grafana (cloud or local)
Launching Grafana can be done in two ways: deploying it in the Grafana Cloud or installing the package on your own server or local computer.
Cloud deployment. For the cloud version, simply create a user account on the Grafana website and select the desired region for deployment. Grafana Cloud offers both free and paid plans, including a Pro plan with a 14-day free trial.
Deployment on a local machine. To deploy Grafana on a local Windows machine, follow these simple steps:
- Download the latest Grafana installer for Windows from the official download page.
- Run the downloaded installer (e.g., grafana-xx.x.x.windows-amd64.msi, where xx.x.x is the version number) and complete the installation by following the prompts.
- Once the installation is complete, start Grafana by running the grafana-server.exe file located in the bin folder of the installation directory (e.g., C:\Program Files\GrafanaLabs\grafana\bin).
- Open a web browser and navigate to http://localhost:3000. Use the default login credentials "admin" for both the username and password.
- After logging in, you can immediately begin creating and customizing dashboards, utilizing various data sources to visualize and analyze your data.
For Linux/Mac installations or if you prefer to use the Docker version of Grafana, refer to the official Grafana documentation for detailed instructions tailored to your specific setup.
Step 3: Installing the JSON API data source plugin
Once Grafana is launched, proceed to the "Connections" or "Plugins" menu in the Grafana interface. Search for the "JSON API" data source plugin and select it. Install the plugin following the provided instructions. This plugin is crucial for establishing communication between Grafana and the Navixy API.
Step 4: Setting up the JSON API data source connection
After installing the "JSON API" plugin, your Grafana instance is ready to connect with the Navixy API using the API key.

Follow these steps to set up the connection:
- Go to "Connections" menu on the left-hand side
- Search for "JSON API" and choose this source
- Click on "Create a JSON API data source"
- Fill in the following fields:
- Name: Choose a preferred name for the data source
- URL: Enter the URL for the Navixy API. Depending on your platform's location, use one of the following URLs:
*https://api.eu.navixy.com/v2/for Europe
*https://api.us.navixy.com/v2/for North America
*<your_configured_domain_api_url>for self-hosted (On-Premise) installations. The default format is usuallyhttp(s)://your_configured_domain/api/ - Query string: Use a query string in the format
hash=[YOUR_API_KEY]&iso_datetime=true. For example:hash=8f6a4353bc5114d977e2068b4e398&iso_datetime=true.
- Customize any additional settings as required, and then click "Save & Test" to verify the connection.
Step 5: Importing the Navixy dashboard template
To expedite the setup process, import the Navixy dashboard template into Grafana. Access the Grafana dashboard management section, create a new dashboard, and select the option to import the dashboard. Upload the provided Navixy dashboard template file. Review the import settings, including the assigned data source, and complete the import process.
Analyzing telematics data with Grafana
Grafana offers a comprehensive suite of visualization objects and tools that empower telematics professionals to analyze and interpret complex telematics data with ease. Let’s explore the elements of the demo dashboard provided by Navixy.

Time range
In the top right corner, you will find the option to select the date range for your analysis. This gives you flexibility in choosing between quick ranges, which provide predefined time intervals, or an absolute time range, where you can specify specific start and end dates.

Line charts
One of the key visualization options provided by Grafana is the line chart, which allows for in-depth examination of sensor readings over time. Telematics data such as fuel level, vehicle speed, and ignition status can be plotted on a line chart, enabling users to identify patterns, trends, and anomalies that might impact fleet performance. With interactive features like zooming and panning, telematics professionals can drill down into specific time periods to gain deeper insights.
To begin, on the demo dashboard, select the desired device using the "Tracker" selector. Once selected, you can create multiple line charts on the same canvas by choosing the desired sensors in the "Sensor 1" and "Sensor 2" selectors.

By toggling the "Raw data" setting between true and false, you have the option to view either raw data or pre-processed data. Raw data represents the unprocessed readings directly collected from the sensors, while pre-processed data is calibrated and transformed for analysis, such as calibrated fuel level data.
To focus on the specific sensor readings that are most relevant to your analysis, you can easily hide or show specific parameters on the graph by simply clicking on their respective labels below the graph.
Tables
The tables on the dashboard offer a structured and user-friendly format to explore raw data from sensors. They present the timestamp when each value was generated and the corresponding value of the selected sensor. This organized presentation allows for a detailed examination of specific data points.
Map view
The map displays in Grafana enable the tracking of objects and events on a map, providing valuable insights into vehicle locations and trips within a chosen time range. This feature offers a comprehensive visualization of past vehicle movements, allowing users to analyze historical data and gain a deeper understanding of fleet operations. Additionally, the table located underneath the map complements the visual representation by providing actual metrics, such as trip length or average speed.
Dashboard customization
As an integrator, you have the flexibility to customize the dashboard elements according to your specific requirements. This includes selecting and configuring different Grafana visualizations for analyzing time-series and other types of data, allowing you to explore the data in the most meaningful way.
Sharing Grafana dashboards
Sharing your customized dashboard with others is a seamless process in Grafana. Firstly, you can export your dashboard as a JSON file, containing all the necessary information to replicate the dashboard on another Grafana instance. This file can be easily shared with team members, clients, or stakeholders, allowing them to import and view the dashboard with consistent visualizations and data.
Additionally, you can share dashboards with clients by embedding Grafana dashboards directly within the Navixy interface. This enables clients to access valuable insights and make informed decisions, all within the familiar Navixy environment. Embedding is possible with both Navixy PaaS and On-premise deployments, and access can be granted system-wide for all customers or restricted to specific accounts only.

Toggle “export for sharing externally”:

Wrapping up: elevating telematics intelligence
With Grafana's integration with Navixy, telematics professionals can visualize and analyze various telematics data, including GPS location and sensor readings. This integration enhances operations related to the installation, configuration, and maintenance of telematics systems, improving overall efficiency and effectiveness.
Furthermore, this integration addresses the specific needs of business customers by allowing tailored data analysis. By delivering meaningful insights and enhancing the decision-making process based on geolocation and sensor data, businesses can optimize their operations and drive better outcomes.
We encourage telematics professionals and enthusiasts to explore the possibilities of Grafana with Navixy by following the provided instructions, trying out the playground, or reaching out to our dedicated technical support team for any inquiries. Unlock the full potential of telematics data with this powerful integration and take your operations to the next level.
On this page