Fuel level sensors play an important role in the fuel management system of vehicles and other technical devices. However, from time to time, the users of these systems may encounter the problem of “noise”, or distortion, in the data that’s transmitted, which can occur for various reasons. Having studied different types of fuel level sensors, it can be noted that any type of sensor—both standard and separately embedded—can generate noise in the transmitted data. No matter the reason, the presence of noise adversely affects the data transmitted by the sensor, while the quality of calculations decreases and the error increases, which is quite a painful issue in the context of fuel control.
In this article we will investigate the causes of noise in the data transmitted by fuel level sensors, as well as explain how Navixy can now analyze and classify the quality of readings. This will enable a deeper understanding of the nature of the transmitted data and, based on the evaluation of the quality of fuel level sensor readings, make effective decisions to minimize calculation errors.
Noise: causes and effects on sensor readings
First, let's define what noise is. Data noise is unwanted or random variations, errors, or distortions that can occur in data. For example, in fuel level sensors, noise can manifest itself as random variations in values or as measurement errors. We have already noted that data noise can have a negative impact on data quality and analysis because it can distort results and lead to incorrect conclusions. As part of the research carried out in the Navixy Lab, we have noticed that the occurrence of situations where fuel level sensors experience noise and fluctuations in their readings is quite common. For the initial analysis, we took 545 fuel level sensors. Of these, we can note 366 (about 70%) that have noise visible in the graph.
To resolve this problem and maintain the accuracy of fuel level measurements, it is necessary to understand the causes of sensor noise. In the following we will look at the various factors that can contribute to fuel level sensor noise.
- Poor quality sensor. Studies show that the most noisy sensor types are the default fuel level sensors installed in the tanks of cars. OEM fuel level sensors are usually float type, where the main elements are a float and a variable resistor. On the GPS tracker side, these are CAN and OBD fuel level sensors.
For high quality fuel calculations, we strongly recommend using a separately integrated fuel level sensor instead of the standard one.
- Improper installation or damage to the sensor. If the sensor is incorrectly installed or damaged, it cannot function optimally, which in most cases will result in inaccurate readings and noisy data. It is important to follow the manufacturer's installation instructions and check the sensor regularly.
We strongly recommend that you contact a highly qualified fuel level sensor installer.
- Corrosion and contamination. Corrosion and contamination are fairly common problems associated with fuel level sensors used in harsh environments or with poor quality fuel. Corroded or contaminated sensor components can affect the accuracy of the sensor and contribute to noise in the readings. Regular inspection and cleaning of the sensor will help prevent these problems.
We strongly recommend servicing the fuel level sensor at least once a year
- Electromagnetic interference. One of the main causes of noise in fuel level sensors is electromagnetic interference. Electromagnetic interference can be caused by various electronic components in the vehicle, such as ignition systems, electrical cables, or radio transmitters. When the sensor is close to sources of electromagnetic interference, the transmitted signal can be disrupted and result in inaccurate readings or noise in the data.
If you observe anomalies in the sensor operation, check the sensor connection to the GPS-tracker and its location in relation to the electrical/electronic components of the vehicle.
- Physical factors. Vibrations and vehicle movement can also cause noise in fuel level sensor readings. Constant movement and vibration during vehicle operation can affect the stability and accuracy of fuel level measurements. This can occur due to mechanical impact on the sensor or the fuel in the tank, resulting in changes in readings. Below is an example of a fuel level sensor that makes noise periodically during physical impact. It should be noted that external factors often have a temporary character and generate noise only in case of direct impact.
In summary, we have established that there are many causes of fuel level sensor noise. From poor quality factory sensors to improper installation or tuning, each factor can lead to measurement errors. However, paying proper attention to fuel level sensors can make a big difference in measurement accuracy and reduce the impact of noise. Next, we will analyze the data and noise in different types of fuel level sensors. The information obtained will help to better understand the quality of the data provided and allow us to recommend further actions
Methods of noise detection and analysis
There are many different methods that can be used to detect, analyze, and classify noise by level. The information obtained from these methods can be used to estimate signal quality based on noise level and apply it to future adaptive filters to remove noise components and preserve useful information. Below, we review several methods.
Wavelet analysis
First, let's consider wavelet analysis, a mathematical method of signal analysis based on the use of wavelet functions. Wavelets are special mathematical functions that allow you to break down a signal into different frequency components. This makes it possible to detect and analyze signals at specific places in time by frequency. In other words, wavelets allow you to identify the different frequency components of a signal. As a result, the noise components of the signal are separated from the useful information. After that, the decomposition coefficients are evaluated and based on the classification by noise level.
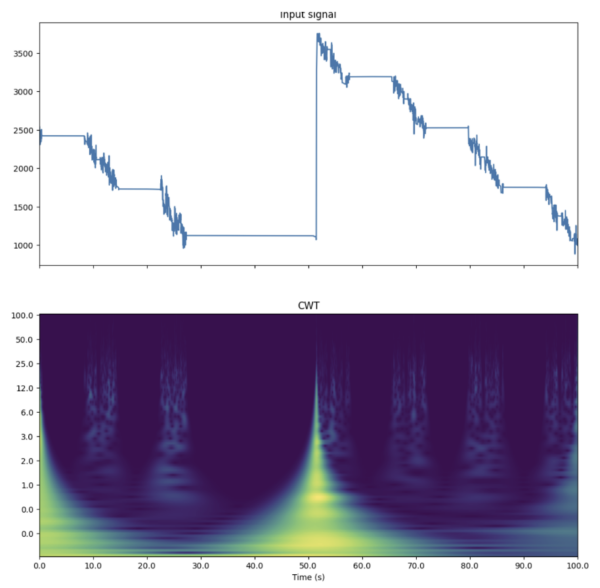
Figure 3 shows an example of applying wavelet analysis to determine the noise level. Sensor data is on top, while the visualization of the frequency spectrum with reference to the graph above is at the bottom. As seen from the frequency spectrum, the refueling event is defined as a strong noise level, which is not quite correct. Thus, drain and refueling events will have a significant impact on the noise level definition. Undoubtedly, such deviations can be filtered, but this imposes additional difficulties in the implementation of the algorithm.
Sliding standard deviation calculation
Next, let's turn to the method of sliding standard deviation calculation, which is another quite common variant of noise level estimation. The essence of this method is that based on the data received from the sensor, a sliding window is selected and moved along the time scale. At each step of the window, the average value of the data within the window is calculated. This average value represents the expected principal component of the data. The standard deviation shows the spread of values relative to the mean and serves as a measure of noise.
The main difficulty in this method is choosing a duration of the time window that will move along the timeline. Empirically it is possible to identify the most appropriate time frame, but because different types of sensors and GPS trackers are used with different settings, including different data transmission periods, we will have situations where different events, such as parking and refueling, will fall within the approved window, which may ultimately lead to anomalies in the noise detection.
Adaptive method
Having analyzed several standard methods, we identified the main problem—using the same method for inherently different events (parking, driving, draining, consuming, refueling, etc.) with high probability can lead to serious errors in noise analysis. Thus, we decided to use an adaptive method of noise detection and classification, which takes different segments of the graph into account and uses a certain algorithm for calculations.
In brief, the algorithm functions as follows. First, the chart is divided into segments depending on the events that occur. Next, smoothing algorithms are applied to certain segments to form a reference ideal graph. More attention is paid to the segments of the graph where the vehicle is moving, since the noise is much higher in those moments as opposed to when the vehicle is parked or refueling. After we get an ideal signal, the algorithm compares it with the original data using statistical analysis methods. This information allows us to perform threshold classification of the signal by noise level.
Our laboratory studies have shown that the above adaptive noise detection and classification method is the most flexible and applicable to a variety of noise sensors used for fuel monitoring. By using dataset segmentation and periodically updating statistical metrics, the algorithm can adapt to changing conditions and dynamically compute thresholds for noise classification. Thanks to this flexibility, the adaptive method provides more accurate and robust detection of noise components in data series compared to other methods. This allows data and data noise to be analyzed more efficiently and provides reliable insights for decision making.
Classification of the quality of fuel level sensor indicators
Classifying the quality of fuel level sensor indicators is an important step in calculating fuel volume indicators, as it helps to determine how accurately and reliably the sensors can measure and transmit data to the system for subsequent calculations. Classifying sensors according to the level of data quality offers the following benefits:
- Determine the quality of the raw data. Understand how accurate and reliable the data collected by these sensors is. Low-noise sensors may provide more stable and reliable data, while high-noise sensors may distort the data and introduce errors into the calculations
- Optimize control processes. Classifying fuel level sensor data quality allows for the selection of the most suitable sensors for specific inspection tasks. For example, in the case of fuel inspection, selecting sensors with a high level of data quality can be particularly important to ensure measurement accuracy and efficiency of the inspection process
- Optimize costs. Classifying the quality of sensor readings can help optimize equipment costs. Sensors with a high level of data quality may be more expensive, but they provide more accurate and reliable measurements, which can reduce the cost of additional inspections.
Based on our adaptive noise estimation and classification method, we can categorize all fuel level sensors into three groups based on the quality of the transmitted indices:
Fuel level sensor reading quality: Low
This result is most often observed on standard fuel level sensors or indicates low accuracy of the installed fuel level sensor. Possible explanation for such low accuracy may be high noise level of the sensor signal, as well as possible malfunction. It should be noted that such a situation can significantly affect the accuracy of the reported data. An example of a graph of data received from a sensor with high noise level is presented in Figure 4.
Fuel level sensor reading quality: Average
This rating indicates acceptable accuracy of the fuel level sensor readings. We realize that this accuracy may be due to various factors, such as increased signal noise from the sensor or specific operating conditions. An example of a graph of data received from the sensor by the average noise level is shown in Figure 5.
Fuel level sensor reading quality: High
This rating indicates that the fuel level sensor readings are highly accurate. Reports based on such reliable readings are the most reliable and provide detailed fuel level information.
Practical realization
Now let's see how this classification is implemented on the Navixy platform.
Quality assessment of fuel level sensor in Navixy
Since the algorithm is applicable to fuel level sensor readings, the result of the evaluation will be displayed in the Fuel Report, where the main source of data for the calculation is the fuel level sensor. In order to get the result, follow these steps:
- Go to the Reports section and generate the "Fuel Level Report" according to the intended parameters, including the selection of the object of interest, time interval, etc.
- Go to the generated report and to the tab with the name of the vehicle of interest.
- The upper part of the report will provide information in the form of graphs and tables with calculated data.
- Go to the bottom of the report to the section titled "Quality of Fuel Sensor (LAB) Readings".
- The information with the results of the fuel sensor performance quality assessment will also be duplicated in a PDF/Excel report generated from this interface by clicking the "Download" icon located in the upper left hand corner
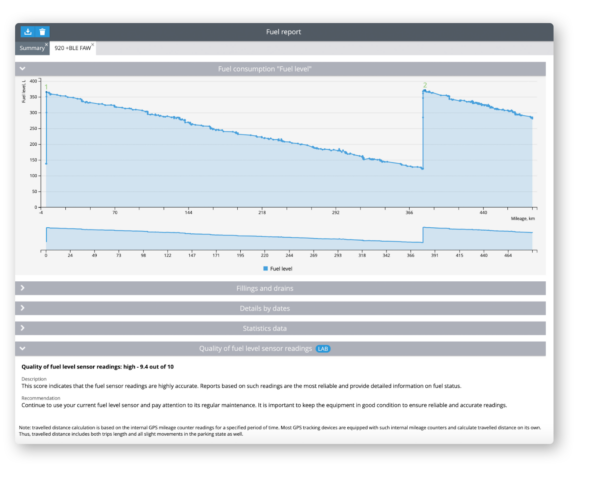
Figure 7 below shows an example of how parameter quality assessment looks like in the Navixy Client Cabinet interface.
If there is enough data to calculate the quality assessment of the sensor indicators, the algorithm will output a quantitative and qualitative result. The quantitative result will be represented as a score from 1.0 to 10.0, with “1” indicating low quality of sensor indicators and “10” high quality. The qualitative indicator is expressed in one of three quality levels: "low", for sensors with a quality score from 1.0 to 3.9, "medium" for sensors with a score from 4.0 to 7.9, and "high" with a score from 8.0 to 10.0, respectively. In addition, the report provides users with information that describes possible causes and recommendations.
If there is insufficient data for the calculation (e.g., if the sensor has been used recently), the system will display the following message: "Insufficient data to assess the quality of the fuel sensor readings. The most probable reasons may be: insufficient number of vehicle trips during the selected period, too infrequent interval of fuel data acquisition, or poor quality of the sensor calibration on the platform. The minimum recommended period for evaluating the quality of readings is 14 days of active vehicle operation.
In addition, the fuel level sensor data quality section contains recommendations. This information allows the customer to perform an initial analysis of the performance of the equipment themselves. The information provided will be useful to customers in making decisions, especially if the results of calculations do not meet their expectations.
Using API to obtain a quality assessment of fuel sensor performance
In addition to the Fuel Report in the Client Cabinet, you can also obtain fuel sensor assessments using an API request. This method makes it possible to automate the collection of information on the quality of fuel sensor readings and use it in third-party applications or systems. This allows for the timely detection of anomalies and taking decisions on their elimination.
Additional parameters are required to retrieve the data, based on the user account data, including tracker and sensor ID number. The result of the query is a decimal number. If the platform returns a NULL value, it indicates that there is not enough data for quality assessment. More information about API queries can be found in the section for developers.
Results
In conclusion, it is worth noting that the Navixy platform continues to evolve and demonstrate greater flexibility and intelligence. Using statistical methods, an adaptive algorithm has been developed to analyze and evaluate the noise of data from different types of fuel level sensors, including both standard and separately embedded sensors. This algorithm allows the Navixy platform to categorize sensors based on data quality and separate them into three categories, providing comments and recommendations for each group. This information will help customers better understand the nature of the data provided by the fuel level sensor and provide recommendations on how to improve readings if data quality issues arise.
In the future, we plan to use the classification results to create high quality graphs that will be visually appealing and understandable to users, achieved through automatic data smoothing. In addition, an advanced user mode will provide the ability to fine-tune the smoothing parameters to match the specific needs of the user. This is expected to significantly improve the detection of events such as drains and refueling, which in turn will improve the accuracy of fuel volume calculations. More accurate fuel consumption data will enable customers to plan and monitor fuel usage more effectively, minimizing potential waste.
