Navixy IoT Logic architecture: receiving, decoding, and processing telematics data

AuthorArtem P., Field Expert, Navixy IoT
Developing IoT solutions requires tools designed for specific tasks, starting with the hardware component, and moving to data collection, processing, tools, and analytics. Challenges and difficulties can appear even in the first stage of this long data journey—long before it is used to solve a problem in the final application.
To start working with IoT device data, you need to:
- Deploy a complete environment, which is necessary to work with data properly
- Realize data decoding based on hardware protocol
- Configure the devices to the correct IP and port
Application developers have to take on the role of a technical specialist and deal with these issues, which in turn requires special skills and substantial expertise. And only after full integration and device customization is it possible to work with data.
The expertise of the IoT Logic (Gateway) team will help you get a stack of ready-to-use tools so you can focus on bigger tasks instead integrating devices and their protocols. Let's take a closer look at the key components of the Navixy IoT Logic (Gateway), as well as their benefits.
Navixy IoT Logic: accessibility and simplicity at every stage
The Navixy IoT Logic (Gateway) is designed to be easily understood and has a comprehensive set of available tools. Below, we'll look at the main benefits at each stage of data handling, as well as the solution's key components.
The IoT Logic (Gateway) performs the following functions:
- Data reception
- Data decoding
- Data processing and calculating
- Diagnostics
- Data transmission to a third-party application, service or repository
Let's briefly go through each of these stages and highlight some of the benefits that the IoT Logic (Gateway) provides.
Data reception
At this stage, the IoT Logic (Gateway) organizes data entry points from various sources. These can be conventional IoT and GPS devices, OEM services, device manufacturers' backends, and other options.
It is quite easy to create an Input endpoint. First, specify its name to simplify further work and select the manufacturer's protocol. You'll be ready to receive your first data point after establishing the device IDs through their bulk import into the IoT Logic (Gateway) platform.
As a result, we have a relatively quick process of creating an endpoint with no complicated settings to understand.
Data decoding
The IoT Logic (Gateway) supports a large number of device manufacturer protocols, which free you from having to integrate the device yourself. After receiving data at the Endpoint, the decoder provides you with the full range of available data supported by the manufacturer's protocol. All you have to do is start working with it.
Data processing and calculating
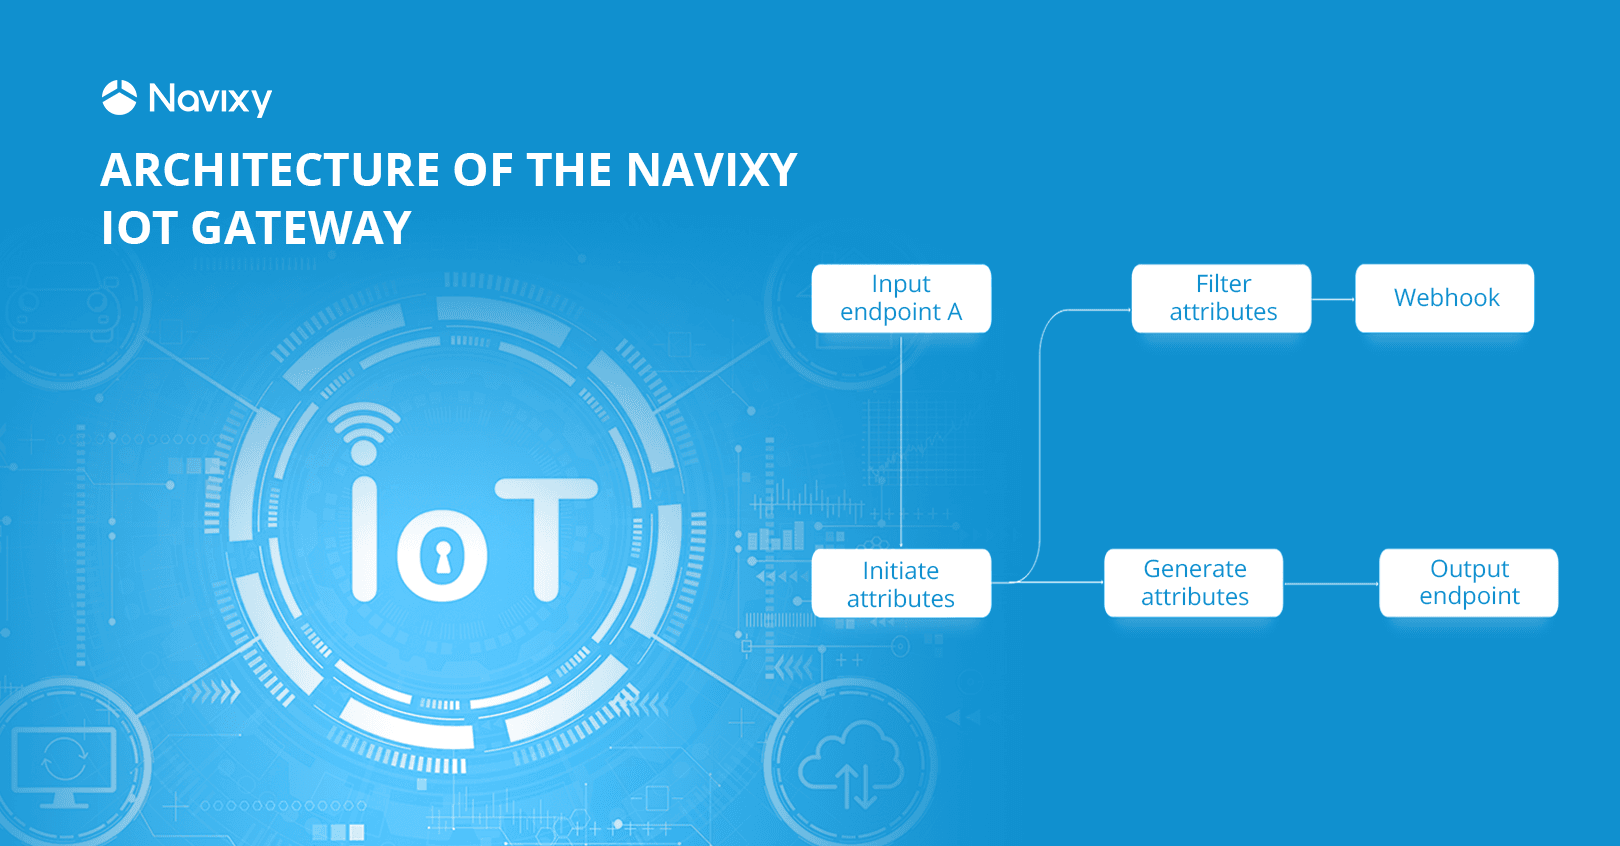
At this stage, the IoT Logic (Gateway) unleashes its potential with intelligent data processing. This convenient visual editor resembles a horizontal flowchart and allows you to visually understand at the top level how the data flows and what processing is taking place at each stage.

Example of data processing scheme
It is worth noting that data manipulation takes place within the framework of the stream, so you can work with data from many devices by setting up the process once.
This editor provides tools for a wide variety of data manipulations:
- Initiate attributes: Select the attributes you need to solve problems in the IoT Logic (Gateway). Cut out the unnecessary, and you'll be much more comfortable with your work.
- Filter attributes: Filter the attributes so only specific information arrives at your target server. This will also be useful when using Webhooks to avoid clogging up messages with unnecessary attributes.
- Generate attributes: A a powerful tool for transforming one data into another, generating attributes is needed for specific tasks and implementing server-side logic. It is a node that enriches the received data before further sending.
These are some of the possible nodes that will help develop your solution. The ability to save and upload threads to the system enables you to scale your solution and share your ideas with other users.
Diagnostics
The Navixy IoT Logic (Gateway) also provides data and flow debugging capabilities. You can visualize live data streams, record message dumps, and view raw decoded data. If you’re already familiar with our Air Console, then the IoT Logic (Gateway) diagnostic tool can be considered an improved version for diagnostics.
Third-party data transmission
At this stage, the client can specify the destination of the resulting data. Simply select the intended destination and set the IP address and port where the data should be sent. The data will be generated in the final Navixy Generic Protocol format, containing your data in an easy-to-use JSON format. Below, you can see an example of the telematics part of the JSON format:
"telemetry": {
        "moving": true,
        "speed": 43,
        "heading": 77,
        "mileage": 7382.333,
        "battery_voltage": 4.12,
        "battery_percentage": 93,
        "ext_power_voltage": 13.9,
        "input_status": 23424,
        "output_status": 23424,
        "driver_key": "12FFABC54234",
        "int_temperature": 12.3,
        "temperature_2": -13.7,
        "custom": {
          "can_speed": 44,
          "can_fuel": 87,
          "can_rpm": 1900,
          "user_data_1": 3454,
          "user_data_2": 1,
          "avl_io_3234": 123,
          "flex_id_22": "abc"
As you can see, rather than focus on what type of equipment was used, the data is now universalised. You only have to receive the data at the other end and use it for your application.
Components of the Navixy IoT Logic: how data moves
We briefly reviewed what the IoT Logic (Gateway) can provide at each stage of data handling. Seeing the overall picture of the IoT Logic (Gateway) product components will add to your understanding and picture of the product as a whole.

In this diagram, you can see that, architecturally, the product is divided into four parts:
- Blue - data reception
- Light blue - processing and routing data within the product
- Dark blue - sending data
- Green - management interfaces and APIs
In addition, the data sources and destination for the enriched information have been placed on this schema and are grayed out for convenience.
Input stream service
The input stream service is the entry point for telematics data traffic from IoT devices and OEM platforms. It also connects to MQTT to receive incoming traffic via MQTT queues. This is where messages from various protocols are decoded.
Queue manager
Kafka acts as a queue manager and a universal message broker, directing the right messages to one or another module, depending on its type. The product's heart sends data streams to the right parts of the IoT Logic (Gateway). This implies the creation of a horizontally scalable platform to handle real-time data streaming with high throughput and low latency.
Data Enrichment Manager (DEM)
One of the central modules of the IoT Logic (Gateway) enriches received data and transforms it into the form that’s displayed in the interface. Here, messages are converted from a unified format into the required format, new fields (virtual/calculable) are added, meta information is added, unnecessary fields are excluded, and existing ones are modified. The configuration of the data modification order is set in the Admin panel using no-code tools. Put simply, this module is the “brain” of the product, where data is enriched and makes more value.
Output stream service
The output stream service sends data to third-party (target) OEM services via either the MQTT Central message broker or by direct transmission through TCP/UDP/HTTP, forwarding messages according to the outgoing stream settings. The default format of outgoing messages is Navixy IoT Logic (Gateway) Generic Protocol (JSON).
Navixy IoT Logic API
This module is responsible for external program interfaces, working with the UI part of the system and third-party integrations. It implements the reception of API requests for user authorization and works with business data and other entities.
Business database
The business data warehouse handles clients, flows, endpoints, and more. This database is a secure repository of user information. The API server works with this database, adding and changing the stored data.
Admin panel
The Admin panel allows the client to interact with the IoT Logic (Gateway) product, including authorization and manipulation of flows, data, and other product entities.
Conclusion
To summarize, the Navixy IoT Logic (Gateway) combines many modern tools and approaches to data decoding and processing, making it an excellent choice for development teams and system integrators. The product's ease of use and understanding allows you to accelerate the deployment of your solutions and products, lowering your entry threshold and development cost. In addition, the universal data format makes it easy for end users to utilize telematics and other information.