Live tracking and history
Track all assets real-time
or refer to history
Real time tracking
Wherever you are you will always stay aware of what's happening. Track your objects within a meter accuracy.
Stay informed of important events and react to any changes immediately.
Track and manage multiple objects
Filter objects to swiftly search needed ones, group them into clusters for viewing on the map in small scale.
Accurate real-time positioning
The best mapping on the market, modern methods of geolocation and real time data update on the screen.
360° street view and traffic
Build less traffic routes. View streets and buildings in 360° at every point of the track.

Instant notifications
Instantly learn about important events, react to changes on time. To start recieving the notifications, create a new rule: pick the needed object and event from the list. That's it.


Telemetry widgets
Take advantage of the real-time business intelligence dashboard. Instantly evaluate and react on current situations: engine performance, cargo condition, breakdowns etc.
- OBD2 and CAN
- remote engine block
- DTC error codes
- cargo info (t, humidity)
- fuel level and consumption
- engine hours and odometer
- special equipment work
- GSM connection status
Trip history
You will not lose any data about trips. All the history is stored for up to three years.
Quick access to information for any period allows not to waste time on gathering the necessary data.

Handy trip browsing
View and compare trips on map. Several ways of visualization help the perception and optimized algorithms allow to quickly display even long trips.
Events and parkings
Display parking, fueling, speeding and other events on the generated trip. Get detailed information with just a click on the event icon.
Trip statistics
Get full access to general information about each trip including length, duration, average speed and fuel consumption. Quick statistics makes it easy to get the data without creating detailed reports.
Time machine: play back trips and events
Getting instant notifications is not always enough, but you have the opportunity to go back in time. The "Time Machine" feature takes you to the day and time of the trip. Reproduce the routes and follow the object moving on the map.


Events history
You will not miss a thing. The history of events will show the exact time and place of the event for each object. Everything that matters to you in constant access: speeding, fuel drainings, deviation from the route and much more. View the data directly on the map, on the timeline or in the reports.
Recent articles
Safe remote immobilization – often called a “safe stop” – is a modern telematics capability that allows fleet managers to remotely disable a vehicle without endangering drivers or the public. This technology has become vital for rental car companies and heavy equipment fleets worldwide, even in developed regions where theft may be less overtly violent…
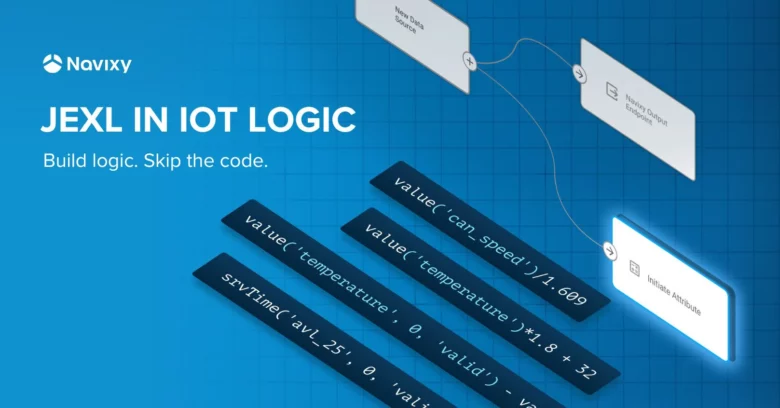
As telematics solutions grow more complex, the need for customized, adaptable logic increases. Navixy’s IoT Logic app, powered by JEXL expressions, meets this demand with a simple, flexible approach. JEXL makes it easy to create dynamic rules and real-time automation without heavy coding. In this post, we’ll show how JEXL can accelerate your telematics projects, even if you’re new to scripting.…
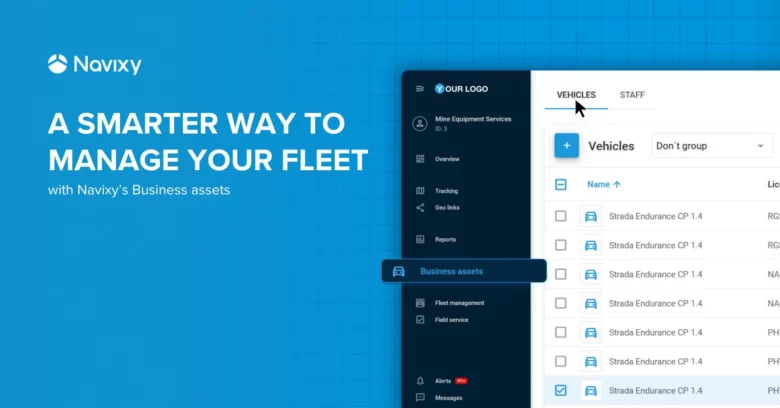
Managing a fleet is about more than just tracking GPS devices — it’s about managing assets and people efficiently.
With Navixy’s new Business Assets feature, fleet managers can now organize vehicles and staff with structure, see real-time relationships, and optimize asset usage.…