The Equipment working time report provides information about the uptime of any unit connected to discrete or virtual inputs. You can also discover the operating time of the equipment both in motion and without motion, obtain daily activity data, and find out when and where the equipment was turned on.
How the Report Works
The report calculates the operating time of the equipment based on the data points received by the platform. It takes into account the running time from the selected discrete input or virtual sensors with two states, as well as the parking status, to distribute the running time between motion and idle time. The platform counts information about equipment working time on virtual sensors for trips. The following configurations must be in place for the report to work properly:
- A discrete input on the device – it must be correctly wired and register the input state accurately.
- Virtual sensor – it can use any calculation method, as long as it has only two states.
- Parking detection settings – these affect the accurate detection of operating time in motion and idling. If the device detects the input state as "on" while the platform determines it to be parked, then the equipment run time will be recorded as idle. For example, if the speed for parking detection is below 3 km/h and the device moves at this speed for more than 5 minutes, all this time will be counted as idle time, not in motion.
When you select a minimum on-time of 60 seconds, the platform calculates the operating time of the equipment as follows:
| Point | Time | Input state | Equipment uptime |
|---|---|---|---|
| 1 | 10:00:00 | off | 0 minutes |
| 2 | 10:01:00 | on | The equipment's operating time will be recorded as 0 minutes. This is because, according to the data received by the platform from 10:00 to 10:01, the input was turned off. |
| 3 | 10:01:32 | on | The equipment's operating time will be recorded as 0 minutes because the minimum duration required for considering a switch-on event is set to 60 seconds, which hasn't passed. |
| 4 | 10:05:32 | off | The equipment's operating time will be recorded as 4 minutes and 32 seconds, as the discrete input remained on for the entire duration until 10:05:32. |
Report Parameters
The report includes the following parameters:
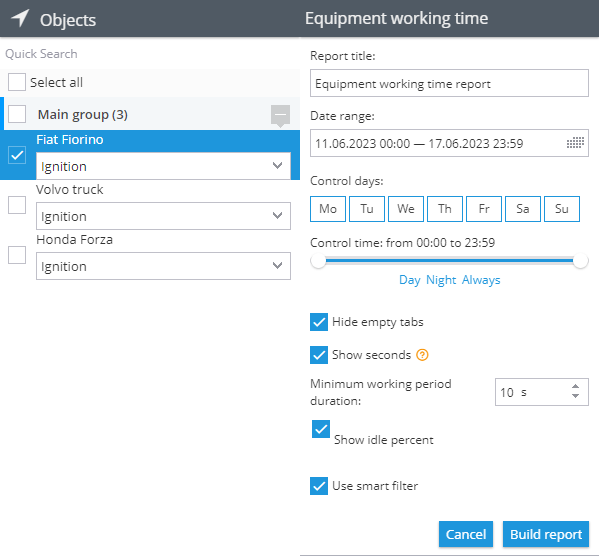
- Minimum working period duration – specify the minimum number of seconds a discrete sensor must be on for the run time to be recorded by the report. If the report is for a virtual sensor, its value shouldn't be 0 to be counted.
- Show idle percent– the report will track the parking status and distribute the equipment operating time between movement and idling.
- Use smart filter – this option will not count short trips. Short trips are defined as journeys shorter than three hundred meters, during which the device sent fewer than 4 data points.
- Device with discrete input or virtual sensor selection – in the list of devices for the report, only those with at least one discrete or virtual sensor configured will be included.
Overall activity diagram for the period
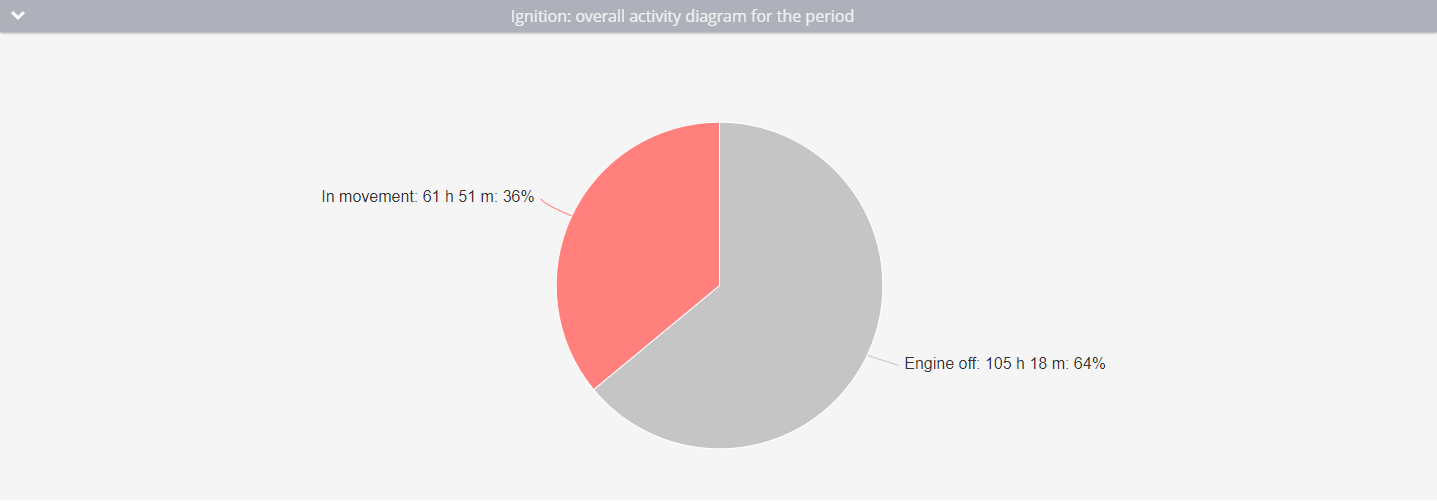
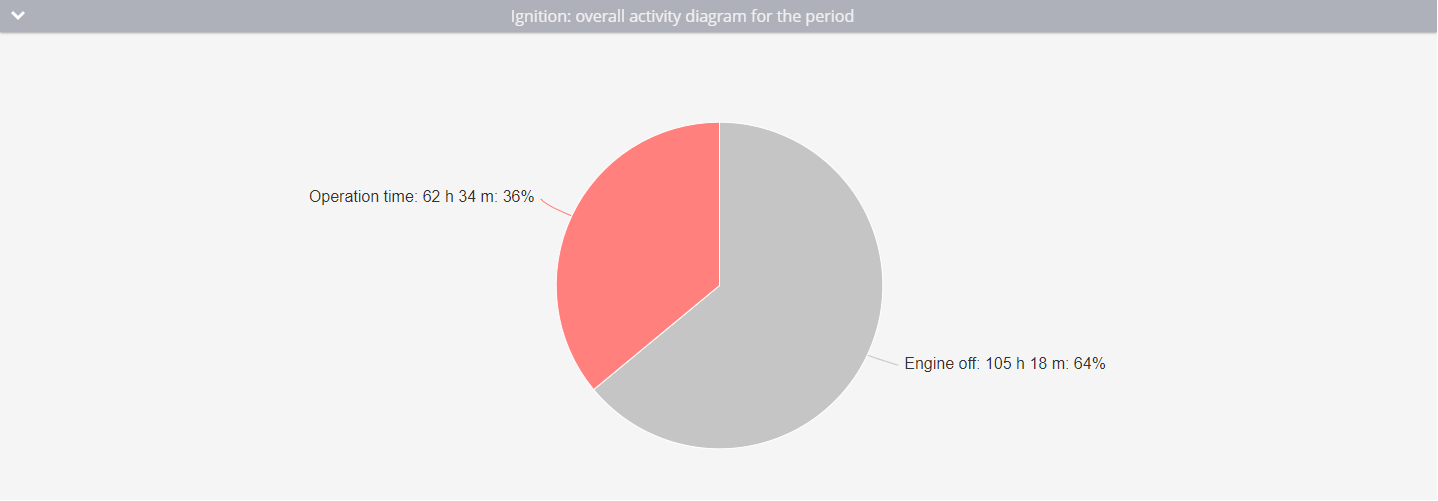
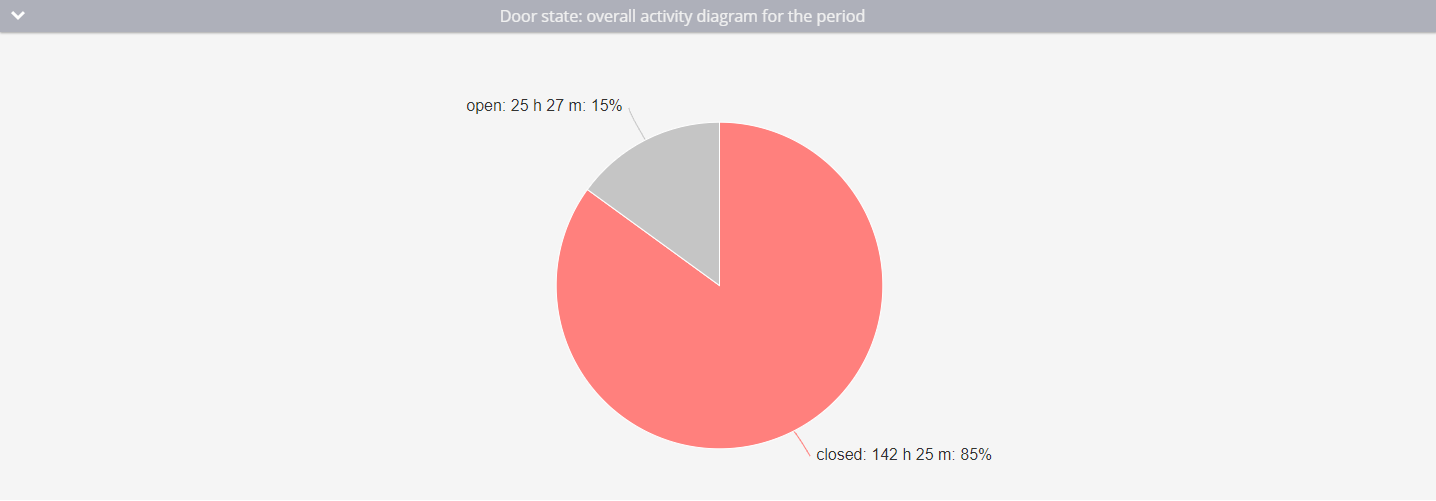
This diagram offers insights into the total working time of the equipment throughout a specified period, showing how long the discrete sensor has been off and how long it has been on. When show idle percent is enabled, the diagram will also illustrate the operating time while in motion and during idle periods.
If you're working with a virtual sensor, the platform will display its virtual state for values in the following manner:
- A virtual sensor state corresponding to a value of 0 will be shown as gray.
- A virtual sensor state corresponding to any other value will be shown as red.
Daily activity histogram
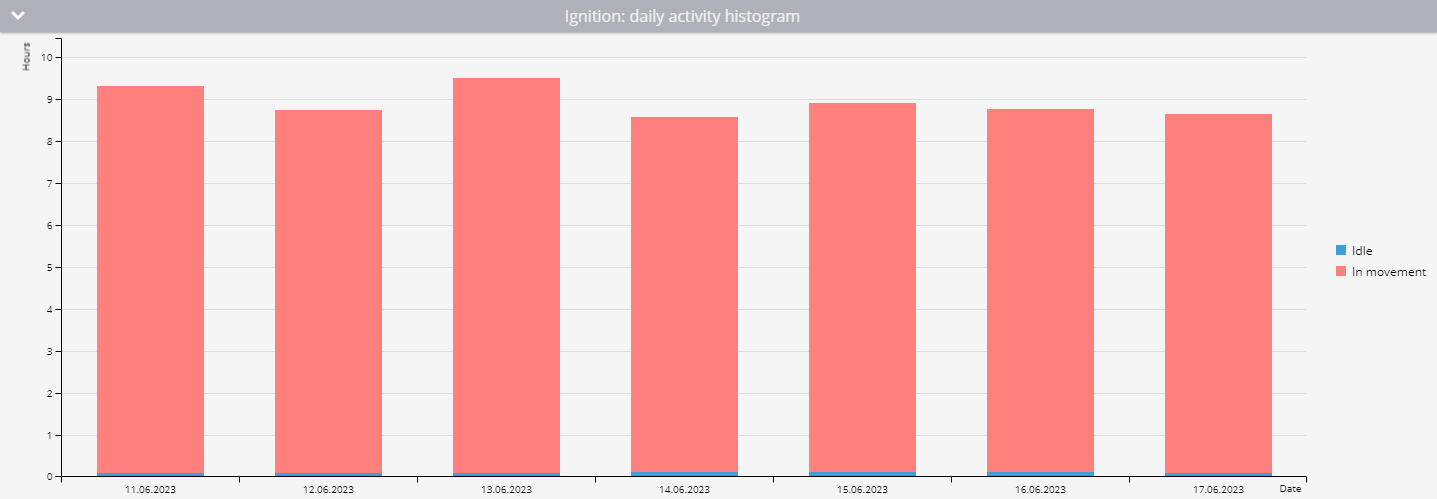
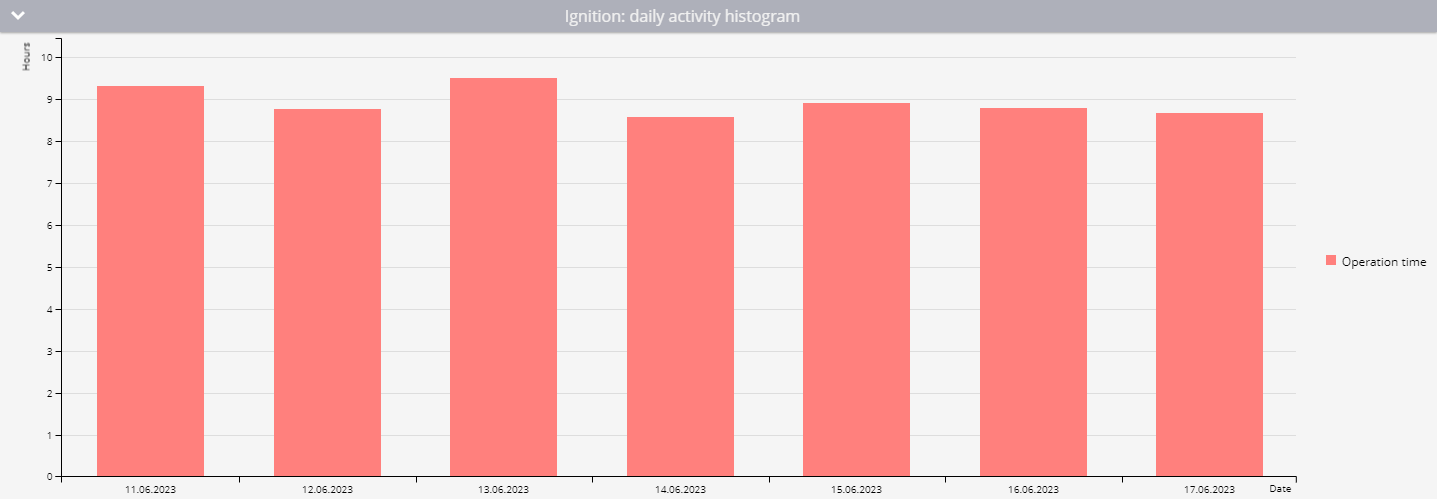
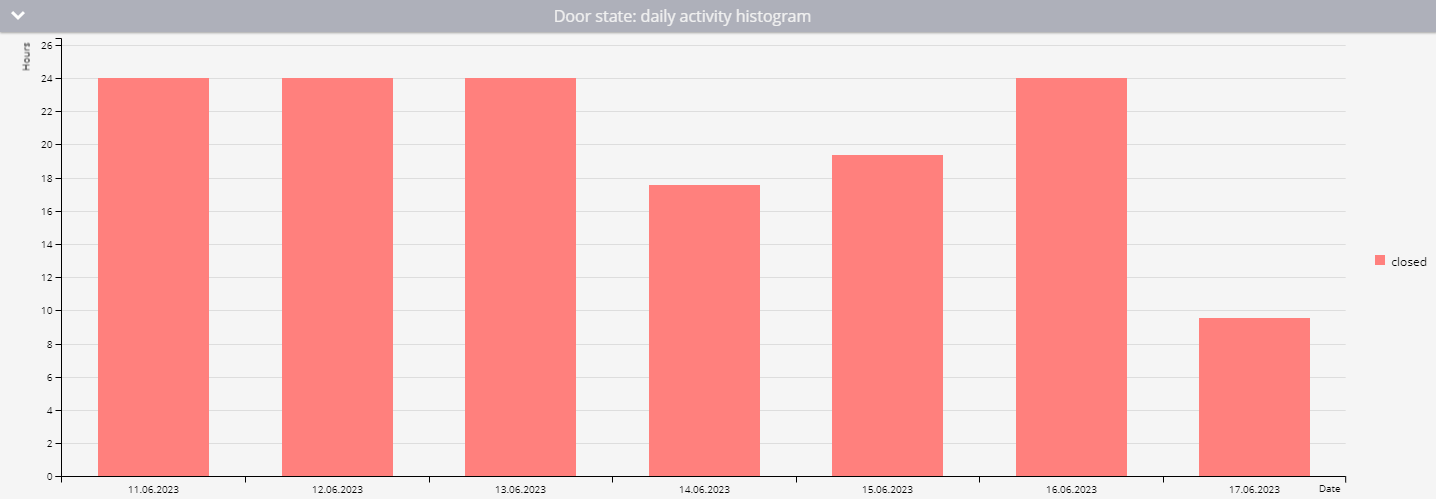
This report showcases the daily equipment working time. If idle percentage is monitored, it also displays the equipment's running in movement and idling time on a day-to-day basis. By hovering over each day's bar graph, you can access more detailed information.
Daily sensor operation time
The table with statistical information about the daily operating time of the equipment. In this table, you can view the number of operating intervals, the average daily operating time of the equipment, as well as the mileage covered with the equipment on and the average speed of the vehicle.
If you enable show idlin percentage, the report will also display information about the daily usage of equipment during motion and idling periods.
The information is presented in the following columns:
- Date: the day for which the information is calculated.
- Operation time or Duration of virtual sensor state: the total operation time for the day.
- Average interval: the average duration the equipment was operational on that day after each switch-on. The total amount of time is divided by the number of intervals.
- Mileage: the number of kilometers the device traveled with the equipment turned on.
- Average speed: the average speed for the day.
- Intervals: the number of times the equipment was turned on during the day.
If showing the idle percentage is enabled, the following columns will be added:
- In movement: the duration of work in motion and its percentage of the total work time for the day.
- Idle: the operation time without motion and its percentage of the total sensor operation time for the day.
The first row from the second screenshot can be interpreted as follows:
On 11/06/2023, the ignition input was on for 9 hours, 19 minutes, and 45 seconds. Out of this time, it was in motion for 9 hours, 14 minutes, and 24 seconds, which is 99% of the total time. The engine was idle for 5 minutes and 21 seconds, accounting for 1% or less of the total time. During this day, the ignition was turned on 41 times with an average turn-on time of 13 minutes and 39 seconds. The vehicle traveled 408.76 km with an average speed of 45 km/h.
The last line from the virtual sensor example can be read as follows:
On 06/17/2023, the door was closed for 9 hours and 32 minutes. Throughout the day, the door was closed 4 times with an average duration of 2 hours and 23 minutes in this state. The vehicle traveled 27.85 km with an average speed of 27 km/h.
Detailed sensor operation time
Here, you can find information about each interval of operation - when and where the sensor on the device was determined to be on and off. The details are organized by day, including the date, day of the week, and the total number of intervals.
The table presents the information in the following columns:
- Operation time: the total time of operation for the interval.
- Switching On: the time and location of the sensor turning on.
- Switching Off: the time and location of the sensor turning off.
If showing the idle percentage is enabled, additional information about the time spent in motion for the interval and its percentage of the total time for the interval will be included.
The first row from the second example can be interpreted as follows:
The first ignition interval occurred on 11/06/2023 and lasted for 11 minutes and 5 seconds. Out of this duration, the vehicle was in motion for 10 minutes and 55 seconds, which accounted for 98% of the total interval time. The ignition was turned on at 00:07:06 and turned off at 00:18:11.
The line for June 14th from the virtual gauge example can be read like this:
During this interval, the door was closed for 1 hour and 9 minutes. The closing time counted from the day start at 00:00 and lasted until the door was opened at 01:09.
Conclusion
The report can be valuable for a variety of purposes, including:
- Analyzing the use of equipment by employees: For instance, you can determine if they turn on the engine, but the car remains idle without any movement.
- Evaluating the efficiency of equipment usage during a specific period: Assess how many hours the equipment is idle in total.
- Estimating when the equipment may need to be replaced based on its usage patterns.
- Calculating depreciation expenses based on the equipment's usage time.
- Recalculating fuel and lubricant consumption not only based on mileage but also considering idle time, especially if the idle time is lengthy. This is particularly relevant for heavy equipment.
- Expanding the number of possible monitored devices by reading data from virtual sensors. This feature is useful for sensors that have two states, one of which occurs at 0.
Overall, this report can be beneficial for anyone looking to optimize equipment usage, improve efficiency, and make informed decisions about equipment maintenance and replacement.
