This report is designed to show you details about engine hours while in motion and during idling periods. It's supplemented with a period activity chart and a daily activity bar graph for easy visual comprehension. Additionally, it displays information about every activity period details.
How it works
It calculates engine hours based on the data points received by the platform. For the information to be included in the report, the ignition must be switched on for at least 60 seconds.
The report takes into account both the ignition status from the ignition input or ignition-based virtual input and the parking condition to distribute the hours between motion and idle times. To ensure accurate engine hour calculations in the report, the following should be configured:
- Ignition sensor on the device. It must be correctly connected and capable of accurately registering the ignition status.
- Discrete ignition sensor or ignition-based virtual sensor on the platform. In your device's settings, make sure to select the correct input that aligns with the device's use.
The parking detection setting influences the accurate detection of engine hours in motion and idle times. If the device detects the ignition is on and the platform detects parking, the engine hours will be recorded as idle. For instance, if the speed for parking detection is below 3 km/h and the device moves at this speed for more than 5 minutes, all this time will be counted as engine hours at idle, not in motion.
The frequency of data point transmissions also impacts the accurate calculation of engine hours.
| Point | Time | Ignition state | Engine hours |
|---|---|---|---|
| 1 | 16:00:00 | off | 0 minutes |
| 2 | 16:01:00 | on | Engine hours will be recorded as 0 minutes. This is because, according to the data received by the platform from 16:00 to 16:01, the ignition input was turned off. |
| 3 | 16:01:32 | on | Engine hours will be recorded as 0 minutes because the minimum duration required for considering a ignition-on event is 60 seconds, which hasn't passed. |
| 4 | 16:05:32 | off | Engine hours will be recorded as 4 minutes and 32 seconds, as the ignition input remained on for the entire duration until 16:05:32. |
If your device doesn't frequently send data and fails to promptly notify the platform when the ignition is turned off with a new message, all the time preceding this message will be accounted for based on the ignition status at the previous point.
Parameters
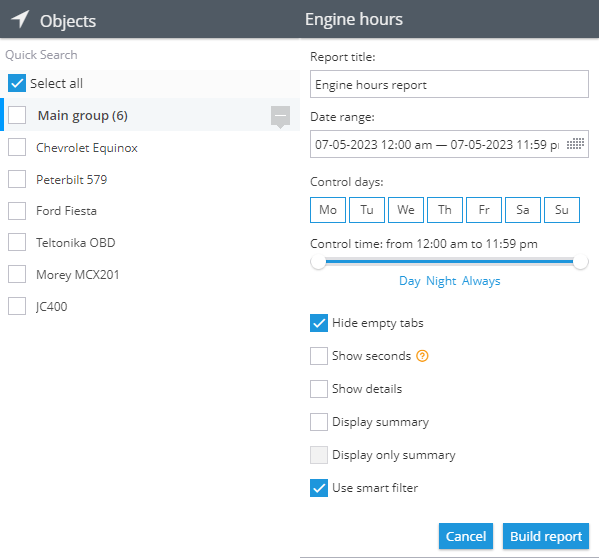
The report comes with the following configurable parameters:
- Show details feature presents detailed information about the specific location and time when the engine was on.
- Display summary option allows you to either enable or disable a page that provides an overview of all devices.
- Display only summary displays aggregated data for several selected trackers. Please note, you must select at least two devices for this feature.
- Use smart filter function excludes short trips from the count. Trips are considered short if they're less than 300 meters, during which the device has transmitted fewer than four data points.
Remember, only those devices configured with the discrete ignition or ignition-based virtual sensor will appear in the device list for the report.
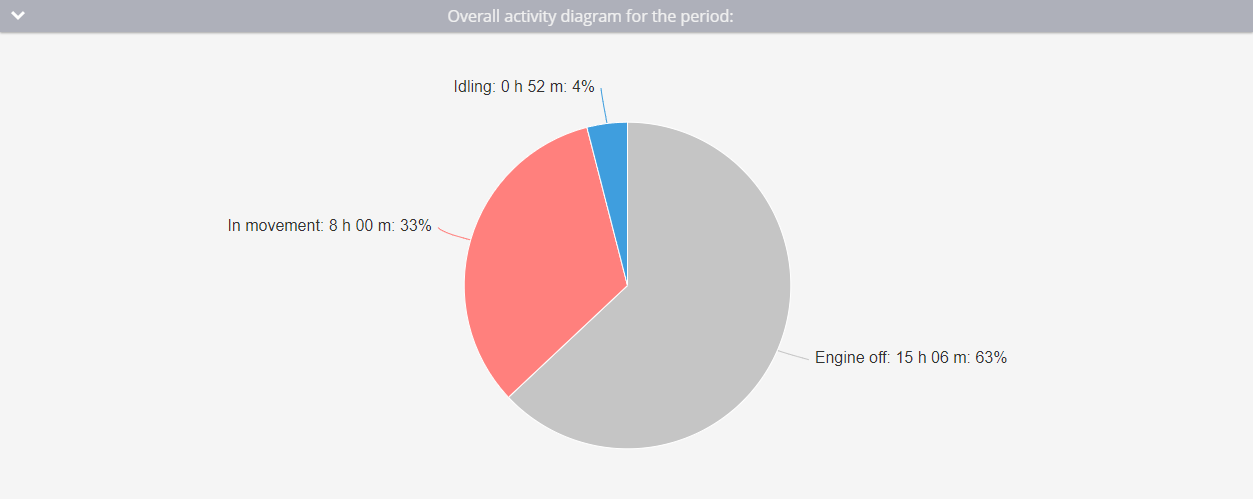
Overall activity diagram
The diagram provides comprehensive information about the total time for the selected period. It details how long the ignition was turned off, as well as the number of engine hours in movement and idling.
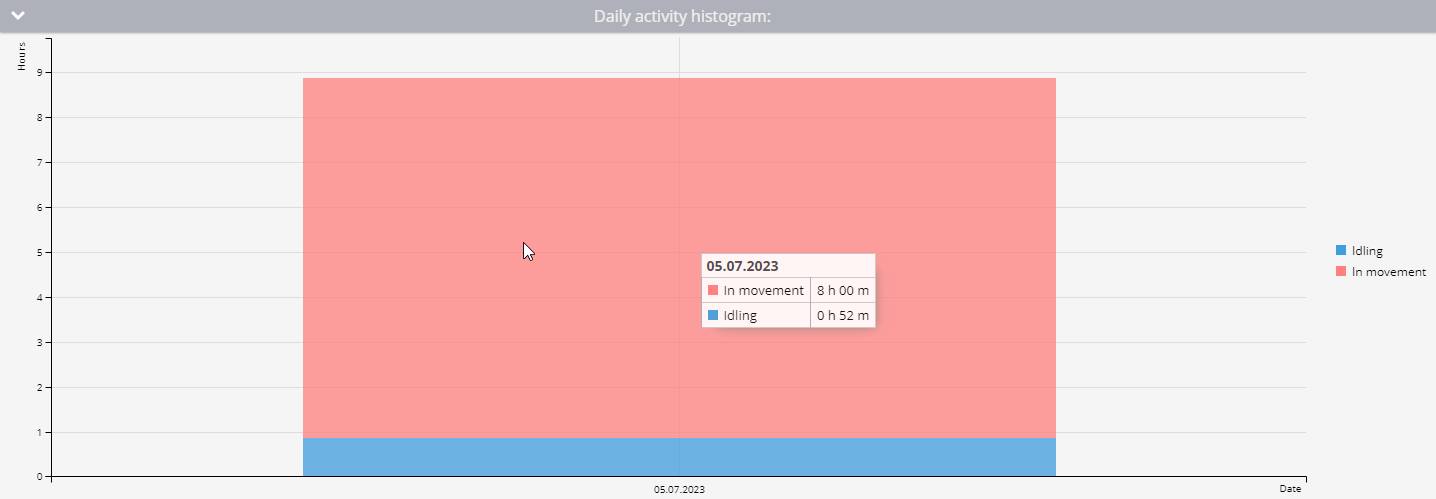
Daily activity histogram
It showcases the number of engine hours both in motion and idle, broken down by day. For a more detailed view, simply hover over each day on the histogram. This will give you an expanded breakdown of that day's engine activity.
Engine hours daily
The table with counted information about engine hours per day.
The table presents information organized in the following columns:
- Date. This is the day for which the data is calculated.
- Engine hours. This represents the total number of engine hours for the day.
- In movement. Here you'll find the number of engine hours when the vehicle was in motion, as well as what percentage of the total engine hours this constitutes.
- Idling. This column shows the number of engine hours spent idling and the percentage of the total engine hours that idling represents.
- Average interval. This reflects the average length of time the engine was running after each ignition on. It's calculated by dividing the total number of engine hours by the number of intervals.
- Mileage. This indicates how many kilometers the tracker traveled while the engine was running.
- Average speed. This reveals the average speed for the day.
- Intervals. This column shows the number of intervals during which the engine was on throughout the day.
Here's how you can interpret the first row:
On July 5, 2023, the total engine hours were 8 hours, 52 minutes, and 29 seconds. Out of this, 8 hours and 47 seconds were spent in motion, which accounts for 90% of the total engine hours. The engine was idling for 52 minutes and 12 seconds, making up 10% of the total engine hours.
The engine, on average, ran for 1 hour, 6 minutes and 37 seconds during each interval. The vehicle covered a distance of 155.22 km that day at an average speed of 19 km/h. Moreover, there were 8 intervals throughout the day when the engine was turned on.
Engine hours detailed
Here you'll find information about each interval of engine operation, specifically when the ignition was turned on and off as detected by the device. This detailed data is organized by date, including the day of the week and the total number of intervals for each day.
Here's a breakdown of the information you'll find in columns:
- Engine hours. This column represents the total number of engine hours for each interval.
- In movement. It shows the total number of hours the engine was on when vehicle was in movement, along with the percentage of time in motion compared to the total engine hours.
- Engine start. It provides the time and location when the engine was started.
- Engine stop details the time and location when the engine was turned off.
Here's how to interpret the information in the table:
The engine was turned on at 10:22:30 and then off at 10:53:08, this means the engine was running for a total of 30 minutes and 38 seconds. Out of this time, the engine was in motion for 7 minutes and 54 seconds, which represents 25% of the total engine hours for that interval.
The entry also includes an address, indicating where the engine was turned on and off. If the location is within a geofence, the geofence's name will appear before the address. In case there are multiple overlapping geofences, their names will be listed and separated by commas.
Conclusion
The report provides valuable information that can be leveraged in several ways. Companies utilizing GPS monitoring in their operations can benefit greatly from these detailed reports, which are based on precise tracker ignition readings.
Here are some potential uses:
- Analyzing engine usage by employees: for example, if employees frequently start the vehicle just to use the air conditioner without actually driving anywhere, they're unnecessarily consuming engine resources.
- Assessing vehicle efficiency: over a given period, you can determine how many hours a vehicle remains idle versus when it's working.
- Estimating replacement timelines: by tracking engine usage, you can gauge when certain parts or even the entire vehicle may need to be replaced.
- Calculating depreciation costs: this is based on the amount of vehicle usage.
- Reconfiguring fuel and lubricant costs: instead of simply using mileage, consider idle time as well. This can be particularly helpful for heavy machinery.


