
Build deeper fleet dashboardsdirectly in Navixy in 1 minute
Navixy introduces Dashboard Studio — a configurable open-source fleet analytics tool for teams that outgrew predefined reports and need to shape telematics data into their own decision center.
Why use Navixy Dashboard Studio?
- You need to deliver analytics relevant to the stakeholder role.
- You crave to configure KPIs, filters, layouts, and visualizations without external BI tools.
- You want to get analytics in the same environment where your team already works.
- You intend to shift beyond static reports toward real-time operational visibility without big investments.
Designed for teams
who need more than standard dashboards
Fleet and operations managers
You need a single version of truth on costs, safety, and service that mirrors their actual fleet processes.
Product, platform, and data leads
You want a standard analytics module which can be embedded, branded, and offered to demanding customers without building a custom BI stack.
Analysts, dispatchers, and fleet managers
Strive to get direct, reliable answers to operational questions: which routes underperform, which vehicles are under-utilized, which drivers idle excessively.
Why do current reporting methods
fall short?
- Static KPIs that do not reflect your unique service model or compliance rules.
- Fragmented analysis across Excel files, screenshots, and personal dashboards.
- BI fatigue: internal teams hesitate to start another Power BI or Grafana project due to cost, talent needs, or maintenance burden.
- Slow reporting cycles where critical trends are visible only in weekly or monthly summaries.
- No clear ownership: defined roles are missing for designing, updating, or maintaining dashboards.
Dashboard Studio resolves these competing requirements inside Navixy.
Schedule a meeting with our expert to learn how you can enhance fleet analytics.
Schedule a call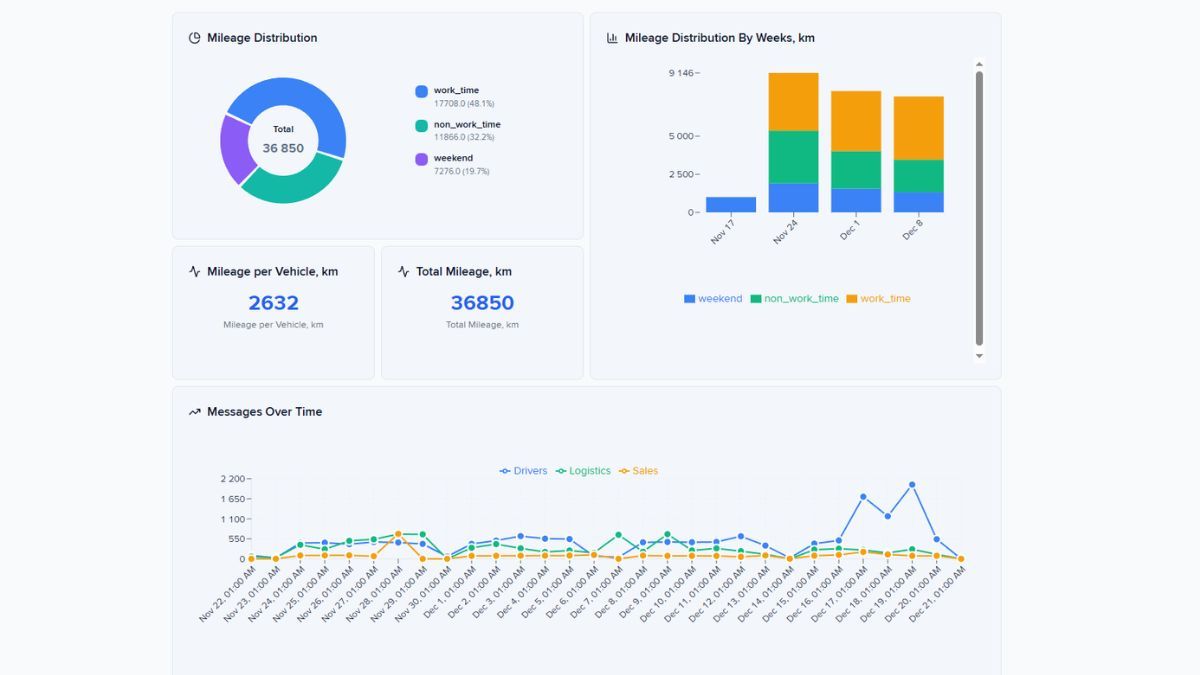
Get a deeper fleet analytics layer,
embedded where your team already works
Dashboard Studio extends Navixy and adds flexibility without asking your organization to run a BI team or manage external tools.
Configurable dashboards
Choose charts, KPI tiles, layouts, and filters tailored to your fleet's workflows.
Governed self-service
Power users define metrics and dashboards; business users rearrange and explore safely.
Real operational clarity
Build panels that highlight cost drivers, safety trends, utilization gaps, delays, or SLA breaches.
Embedded experience
Dashboards live inside Navixy and partner portals — zero context switching.
Template-ready
Use Navixy-provided starting templates for fuel, maintenance, geospatial movement, and safety performance.
IoT Query-ready foundation
For teams with analysts, dashboards can sit on top of IoT Query to bring SQL-defined KPIs directly into the visual layer.
Create fleet management dashboards
tailored to your KPIs
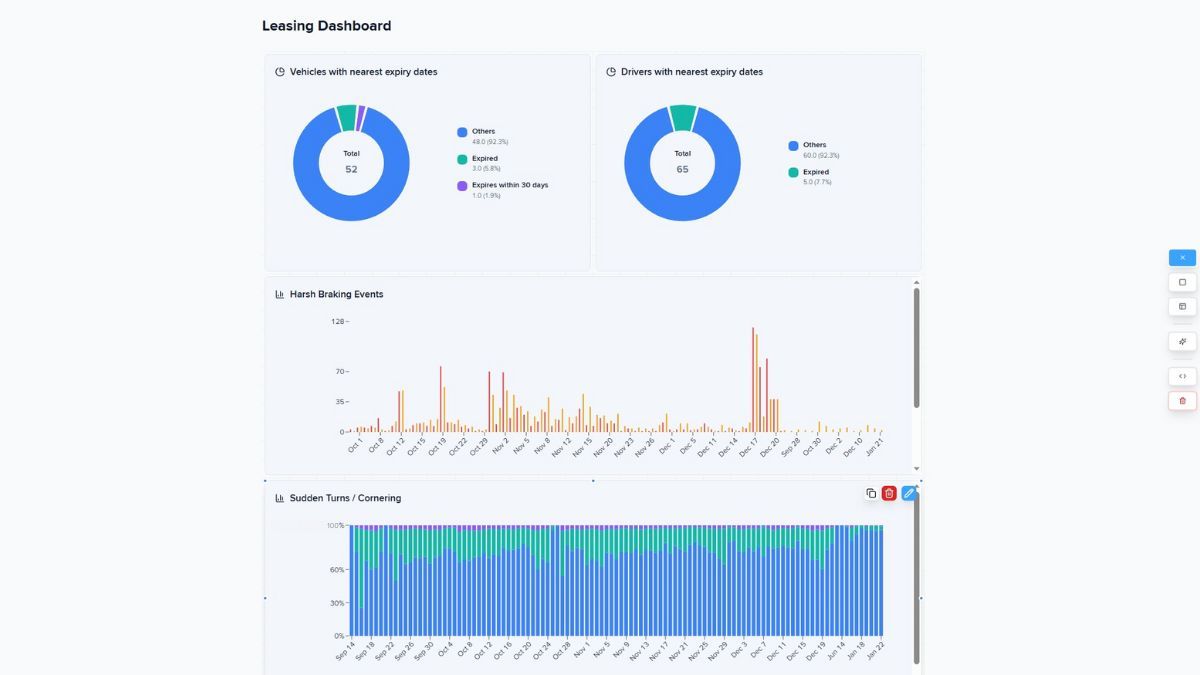
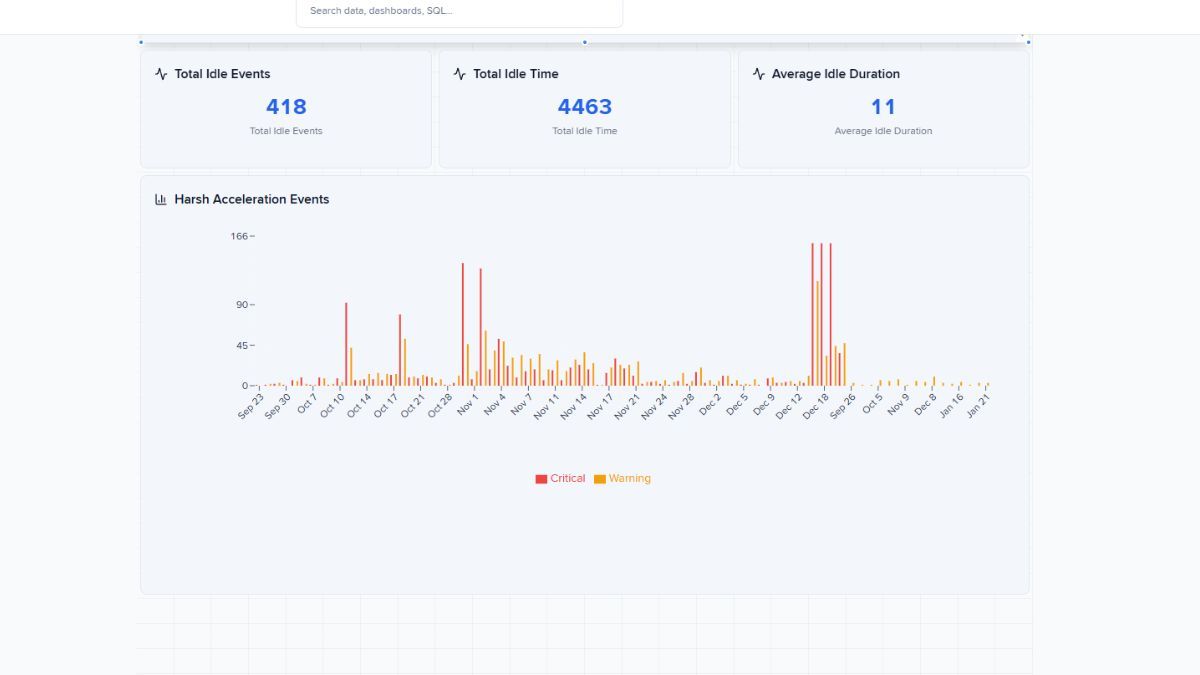
Decision center
Monitor fuel per km, idling, harsh events, utilization, maintenance exposure, and SLA deviations.
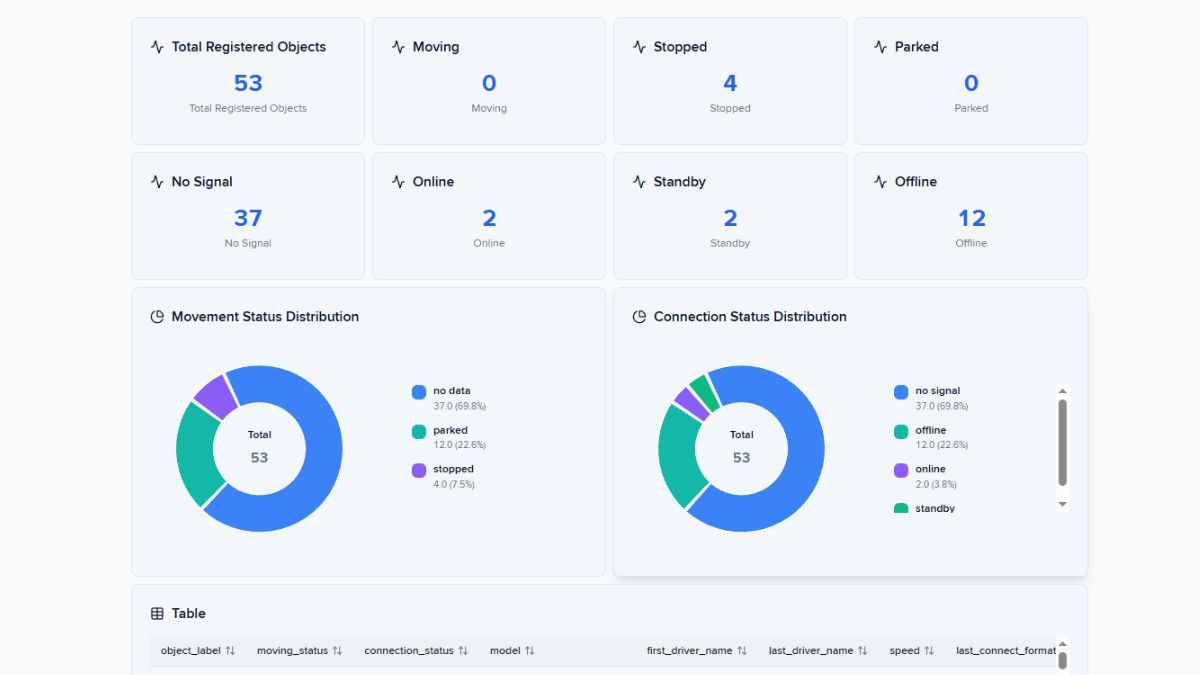
Operational awareness
Track active vehicles, route adherence, sensor values, task completion status, driver availability, and dispatch KPIs.
Historical trend analysis
Identify seasonal demand, cost patterns, or recurring inefficiencies to support budgeting or board reporting.
Partner-branded analytics
Deliver configurable dashboards to your customers without running your own BI stack.
Build custom reports
that drive business decisions
Your business context
Start with a clear question — e.g., "Which regions show increasing idle time this quarter?"
One SQL query, three-view output
Use a single SQL query that feeds all report components — saving time and preserving consistency.
Configurable interactive components
Customize which views you include (a table, a chart, a map) and choose how stakeholders will interact with the data.
Several export options
Download polished reports in Excel, CSV, HTML, or PDF — ready for analysis, integration, presentations, or compliance.
Personalize fleet analytics natively
Dashboard Studio complements the dashboards you already use in Navixy. It is designed for deeper, customizable analysis — not to replace standard operational panels.
Use Navixy's structured data model
All fleet, telemetry, driver, sensor and task information is already organized so dashboards use consistent KPIs.
Build dashboards in a few clicks
Drag components, pick time ranges, apply filters, and shape your decision center.
Define metrics once
Power users configure formulas or KPIs; dashboard viewers use them without risk of accidental changes. Leverage our ready-to-use SQL-queries Recipe Book or templates to create your own dashboard effortlessly.
Embed and export dashboards
Place dashboards in the Navixy portal or partner portals to keep operators and analysts aligned.
Extend via IoT Query
For advanced teams, IoT Query allows SQL-defined KPIs, real-time data access, and more complex cross-joins between telematics and business data. Dashboards can consume these enriched metrics.
Ready to build your own fleet decision center?
Enable Dashboard Studio to support your teams with a deeper analytics layer that fits your operations, KPIs, and customers.
Contact sales