How to turn tire pressure monitoring into a reliable source of safety, compliance and operational insight for fleets

AuthorArtem P., Field Expert, Navixy IoT
Tire pressure matters, yet the readings behind it often arrive in formats that don’t match or make much sense. When the data is inconsistent, even good hardware cannot support safe, steady operations. This article shows how IoT Logic helps fleets automate the process and turn raw tire signals into clear information they can use, based on our customer’s case.
Key takeaways
- A tire pressure monitoring system warns when tire pressure drops and is key for safe, compliant fleet operations.
- Unstructured data and slow checks mask early problems, raise costs and undermine compliance.
- IoT Logic turns varied tire data into clear wheel insights with no manual steps and improves safety, audits and daily work.
Tire pressure monitoring: what if tire issues go unnoticed
Even though tire issues have a major impact on fleet safety and compliance, many of them are hard to spot quickly enough to prevent trouble on the road.
Underinflated or worn tires remain among the primary factors contributing to vehicle crashes. For example, in the United States, data from road safety agencies indicate that in 2024, tire defects were involved in approximately 11,000 vehicle collisions and resulted in about 200 deaths nationwide. Poor pressure is also linked to nearly 300,000 accidents each year. Low pressure increases stopping distance, reduces vehicle stability, and raises the chance of a blowout, especially at high speeds or under heavy loads. Many drivers might still ignore pressure warnings, which adds to the risk.
No wonder regulations have been tightened worldwide. New heavy-duty vehicles and trailers registered in the EU and other markets must include a tire pressure monitoring system by law. These rules aim to reduce accidents and operating costs by improving how fleets monitor tire health.
With safety, compliance and daily performance at stake, fleets need a better way to understand what their tire data is telling them.
The usual approach produces late, incomplete, or inconsistent data
The problem is that manual checks, which have been common in fleets for decades, no longer give teams data they can rely on.
- Manual routines leave too many gaps. Drivers or mechanics use pressure gauges during walkarounds or scheduled maintenance, often just before a trip. This can catch obvious issues, though a rushed inspection, a missed shift, or a long interval between service stops can allow pressure drops or early wear to go unnoticed. Many fleets might still rely on these routines for various reasons. For instance, they operate older vehicles or have limited budgets.
- Mixed tire pressure monitoring sensor (TPMS) data is difficult to use. Some fleets use tire pressure monitoring systems, though the data is rarely uniform. Each vendor reports information in its own format. Direct systems send pressure and temperature from each wheel, while indirect systems estimate pressure based on ABS behavior. When hardware from different suppliers is mixed, managers receive readings that cannot be compared or combined without extra effort.
- Inconsistent records slow responses. Teams often work with spreadsheets, fragmented reports, and handwritten notes. These records are easy to misplace, and they rarely match across sources. Inconsistent data delays responses to low-pressure events, complicates compliance reporting, and increases the chance that a problem stays hidden until it becomes costly.
When fleets cannot make sense of their tire data, there are avoidable risks, from delayed detection of pressure drops to roadside breakdowns and higher accident exposure. Making it make sense manually might be slow, costly, and inefficient. At this point, automating the way this data is processed and unified makes a real difference, as a recent customer case shows.
Improving tire pressure monitoring with IoT Logic. Customer case
A Navixy customer used certain Navtelecom trackers in their operations. These trackers came with tire pressure sensors for each wheel of a vehicle. Each device sent data in a rotating set of model fields: one parameter held the wheel number, while three others carried that wheel’s pressure, temperature, and status. Every few seconds, the wheel number changed, and the same fields were updated with the next wheel’s readings.
Because these parameters were generic, they could also receive data from other sensors. Decoding which wheel each reading belonged to would have normally required broad code changes or custom scripts, which were impractical when every customer and TPMS vendor formatted data differently.
The customer sought a solution that would work across devices without creating extra effort for users.
Discover another customer case on automating sobriety checks for drivers with IoT Logic.
The solution: using IoT Logic to turn rotating tire pressure monitoring data into clear tire readings
IoT Logic made it possible to handle this case without custom development.
A quick reminder: IoT Logic is Navixy’s no-code workflow automation tool that allows building data pipelines, or data flows, if you will, for specific operations, including complex calculations, condition-based actions and device commands. To build flows, one simply drags and drops necessary elements, nodes, to the working space and connects them. Then IoT Logic handles the processing.
So, for the customer we built a flow using Logic and Initiate attribute nodes.
Navtelecom trackers use parameters called Flex ID. In this configuration:
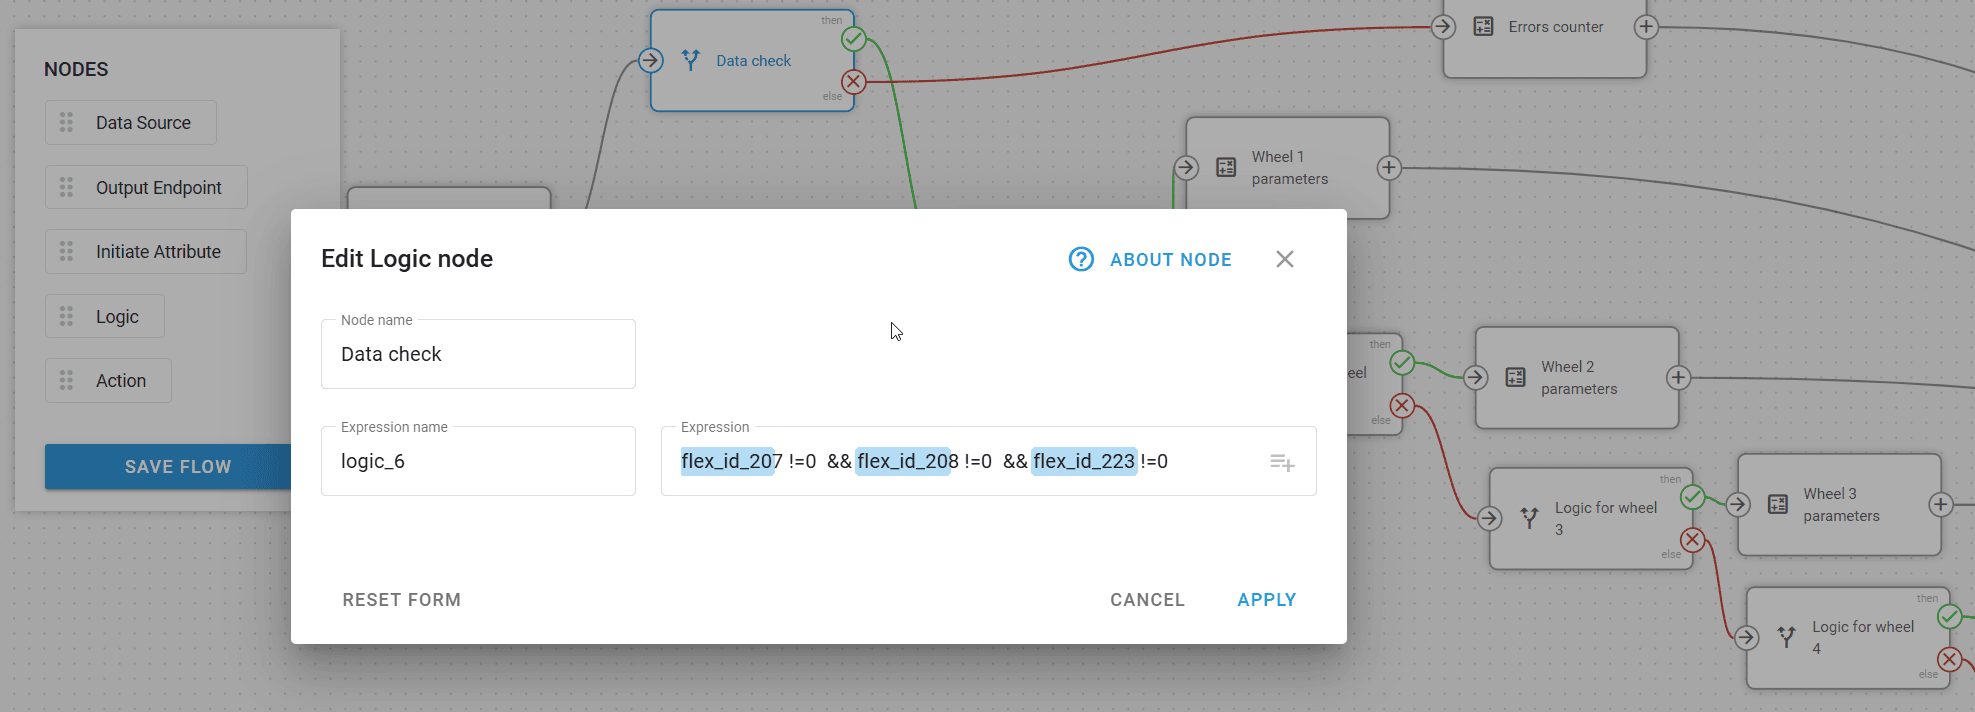
- Parameter 207 carries the channel number.
- Parameter 208 carries tire pressure from the current channel.
- Parameter 223 carries tire temperature.
- Parameter 209 is a bit-packed field where specific bits indicate sensor connection status, battery level, or detection of a flat tire.
Here’s what the flow looks like.
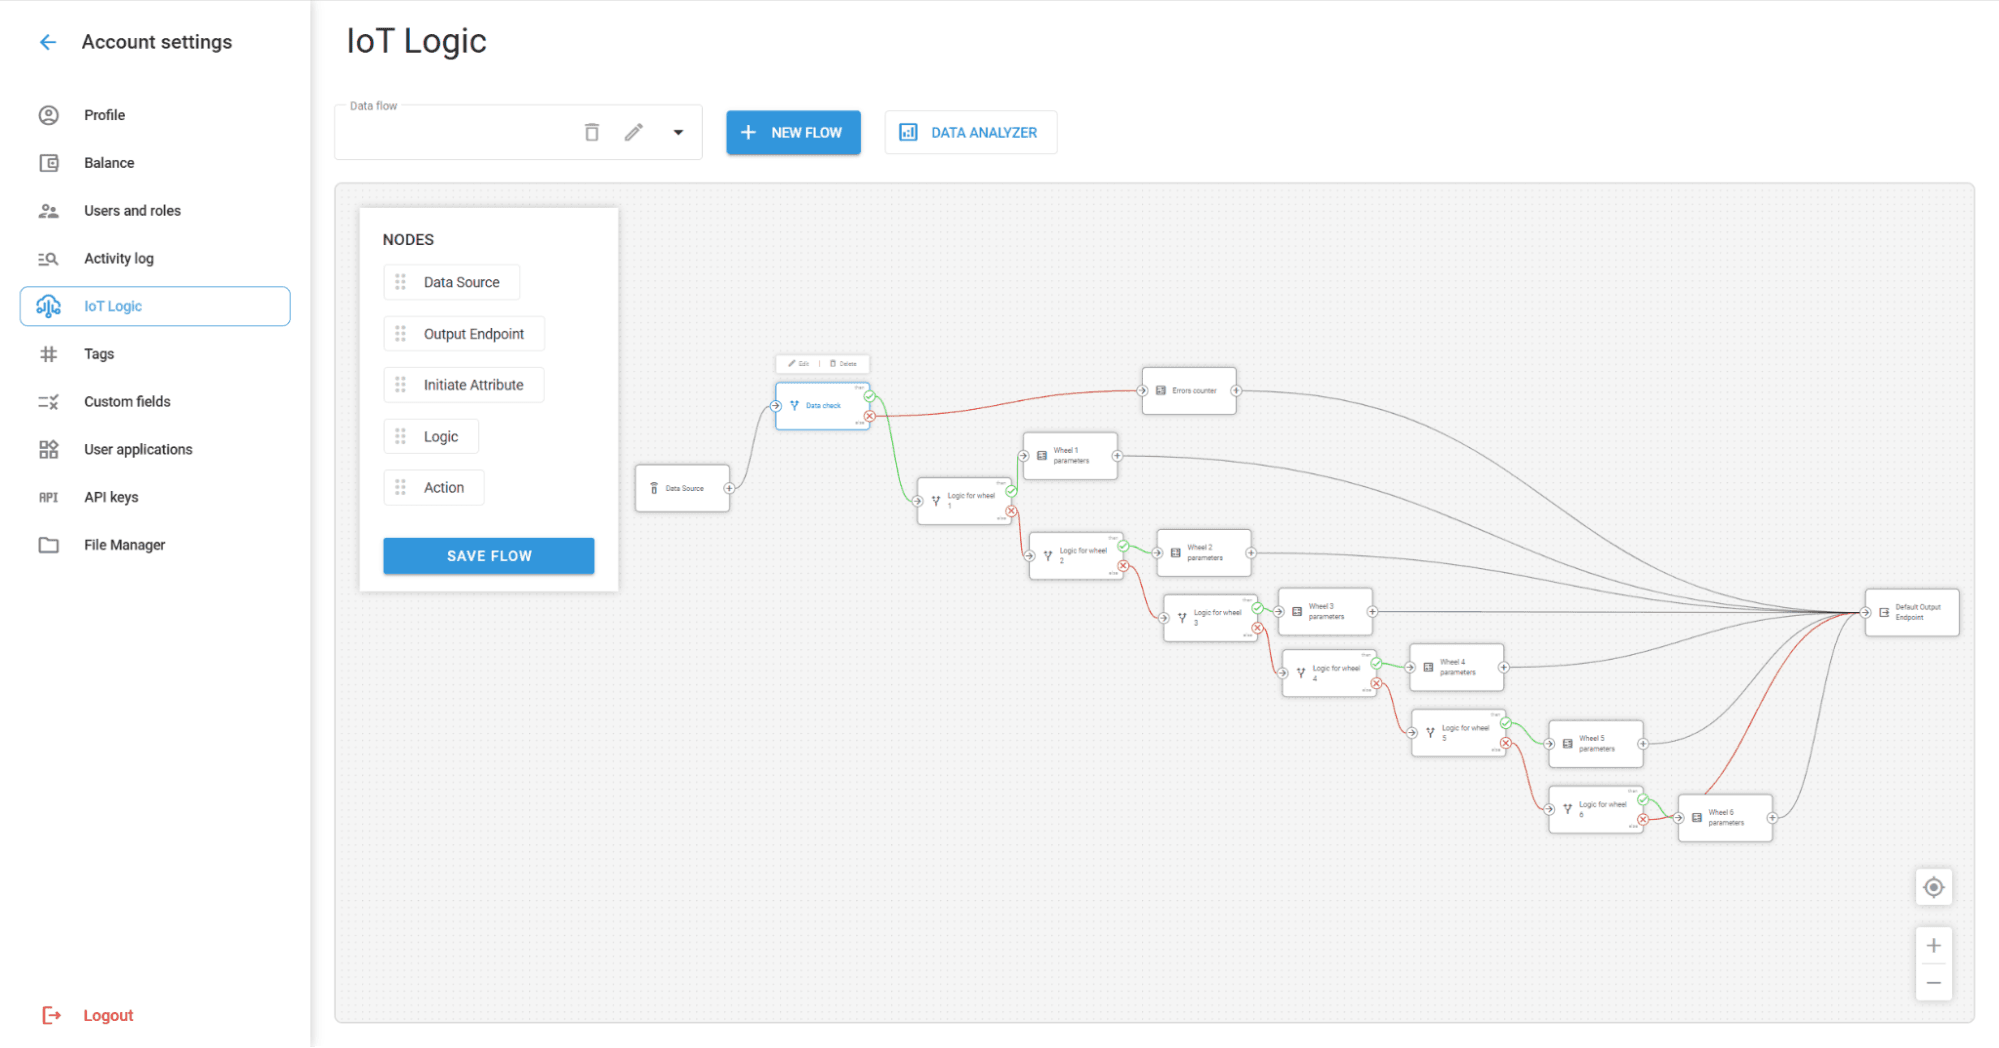
Now, let’s walk through it step by step.
We first added a data check with a logic node. If the channel, temperature, and pressure values were all non-zero, we processed them. If not, we counted the packets as faulty.
When the value for flex_id_207 is 1, the readings belong to channel 1.
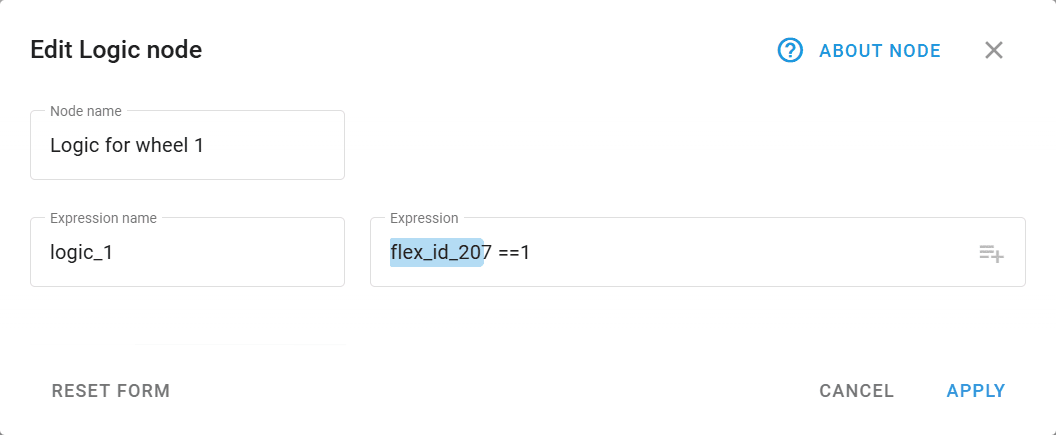
We created separate sensors on the Navixy platform for each attribute using the initiate attribute node: pressure 1, temperature 1, and three tire-status attributes decoded from the combined field with bitwise operations.
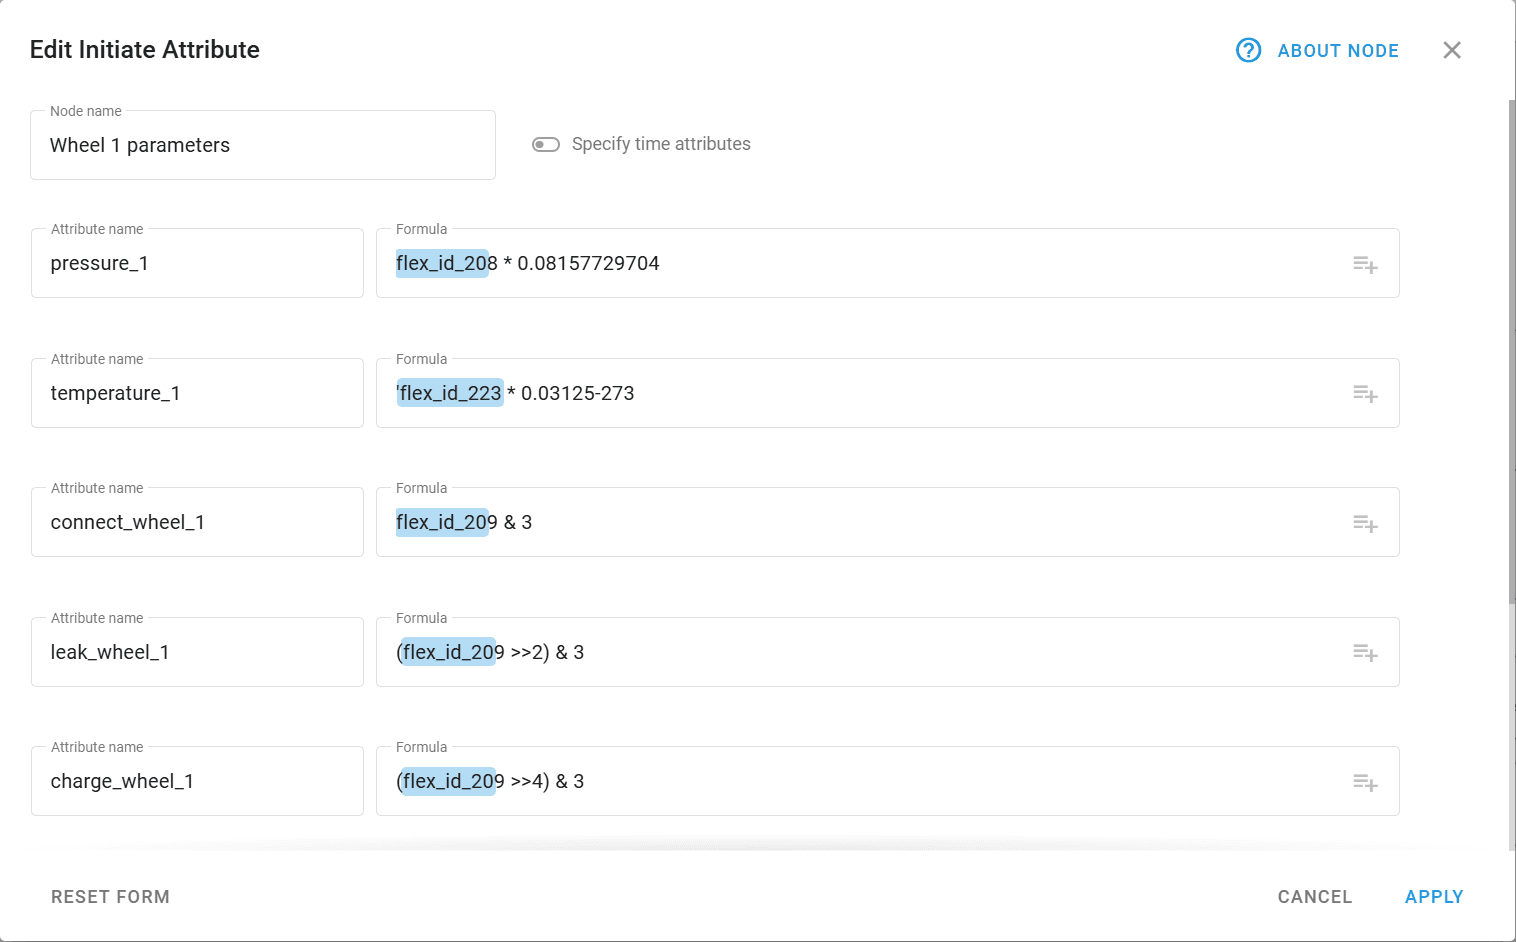
If parameter 207 equals 2, the logic repeats for wheel two, and so on for all six wheels. All resulting data is sent through the default output endpoint node, which forwards every derived attribute to the Navixy platform.
A key advantage of IoT Logic is that this flow works for any device using the same protocol. There is no need to build a separate flow for every tracker. When a user or technician creates new sensors on the Navixy platform, they immediately see the correct attribute names and can assign them to the device.
Besides, we configured rules for each attribute to track:
- loss of contact with a wheel sensor
- low battery in the tire sensor
- pressure leaks, low pressure, and high temperature
Alerts go to the responsible dispatcher, who contacts the driver or mechanic with details about which wheel needs attention.
This helped our partner solve a difficult tire-monitoring challenge quickly and offer a clearer service to their customers. They are now developing dashboards for both the web interface and the mobile app to make tire monitoring even easier.
The outcome: reliable tire pressure monitoring at fleet scale
Once the flow went live, the customer finally saw clear, wheel-specific readings instead of rotating fields. This reduced the chance of missing early pressure drops, helped avoid unexpected stops on the road, and made day-to-day maintenance planning more predictable.
Compliance improved as well. With every tire attribute structured according to regulatory expectations, the operator no longer needed spreadsheets or manual checks to prove that the fleet was monitored consistently. Everything the auditor needed was already in place.
A process that once required steady manual effort now runs on its own. IoT Logic interprets each packet, extracts the right values, and keeps every attribute updated in real time. Instead of decoding payloads, the team can focus on acting when something needs attention.
The same flow now supports the entire fleet. Any Navtelecom device using the same protocol can join without custom work or per-vehicle tuning. Adding new assets is as simple as assigning the existing attributes, which keeps expansion smooth for both the operator and the partner who supports them.
For the telematics partner, this unlocked operational and commercial benefits. Support teams spend far less time troubleshooting raw data. Product teams can build dashboards and alerts faster because the attributes are predictable. And the business can offer tire-monitoring services across mixed fleets without needing custom integrations.
Why structured tire data changes more than tire monitoring
This case shows how much potential sits inside everyday sensor data once it is structured properly. For fleets, it proves that tire pressure monitoring can be more than a warning system. When the data is clear and consistent, it becomes a steady source of insight that supports safer driving, smoother maintenance planning, and stronger compliance.
For telematics businesses, it opens a path to more mature, reliable services without constant custom engineering. A single logic flow can support mixed hardware, reduce support workloads, and make feature development more predictable. It gives product teams the confidence to build dashboards, alerts, and reports that work the same way across the entire customer base.
And this is only one scenario. The same IoT Logic capabilities can be applied to fuel-level corrections, axle-load calculations, cold-chain monitoring, PTO tracking, or any case where raw signals need structure.
If you have a similar challenge or would like to see this flow in action, book a demo and let’s explore how the solution can be adapted to your operation.
On this page