Know Who Did What, Where, and When
Built-in reports turn GPS tracks, job statuses, and field forms into clear performance and productivity metrics.
Analyze Data to Improve Mobile Operations
Analyze workforce productivity, fuel expenses, maintenance costs, and customer satisfaction rates with comprehensive business analytics and reporting.
Take a deep-dive into operations to make confident, evidence-based decisions about what aspects of the business to improve and develop strategies to get it done.
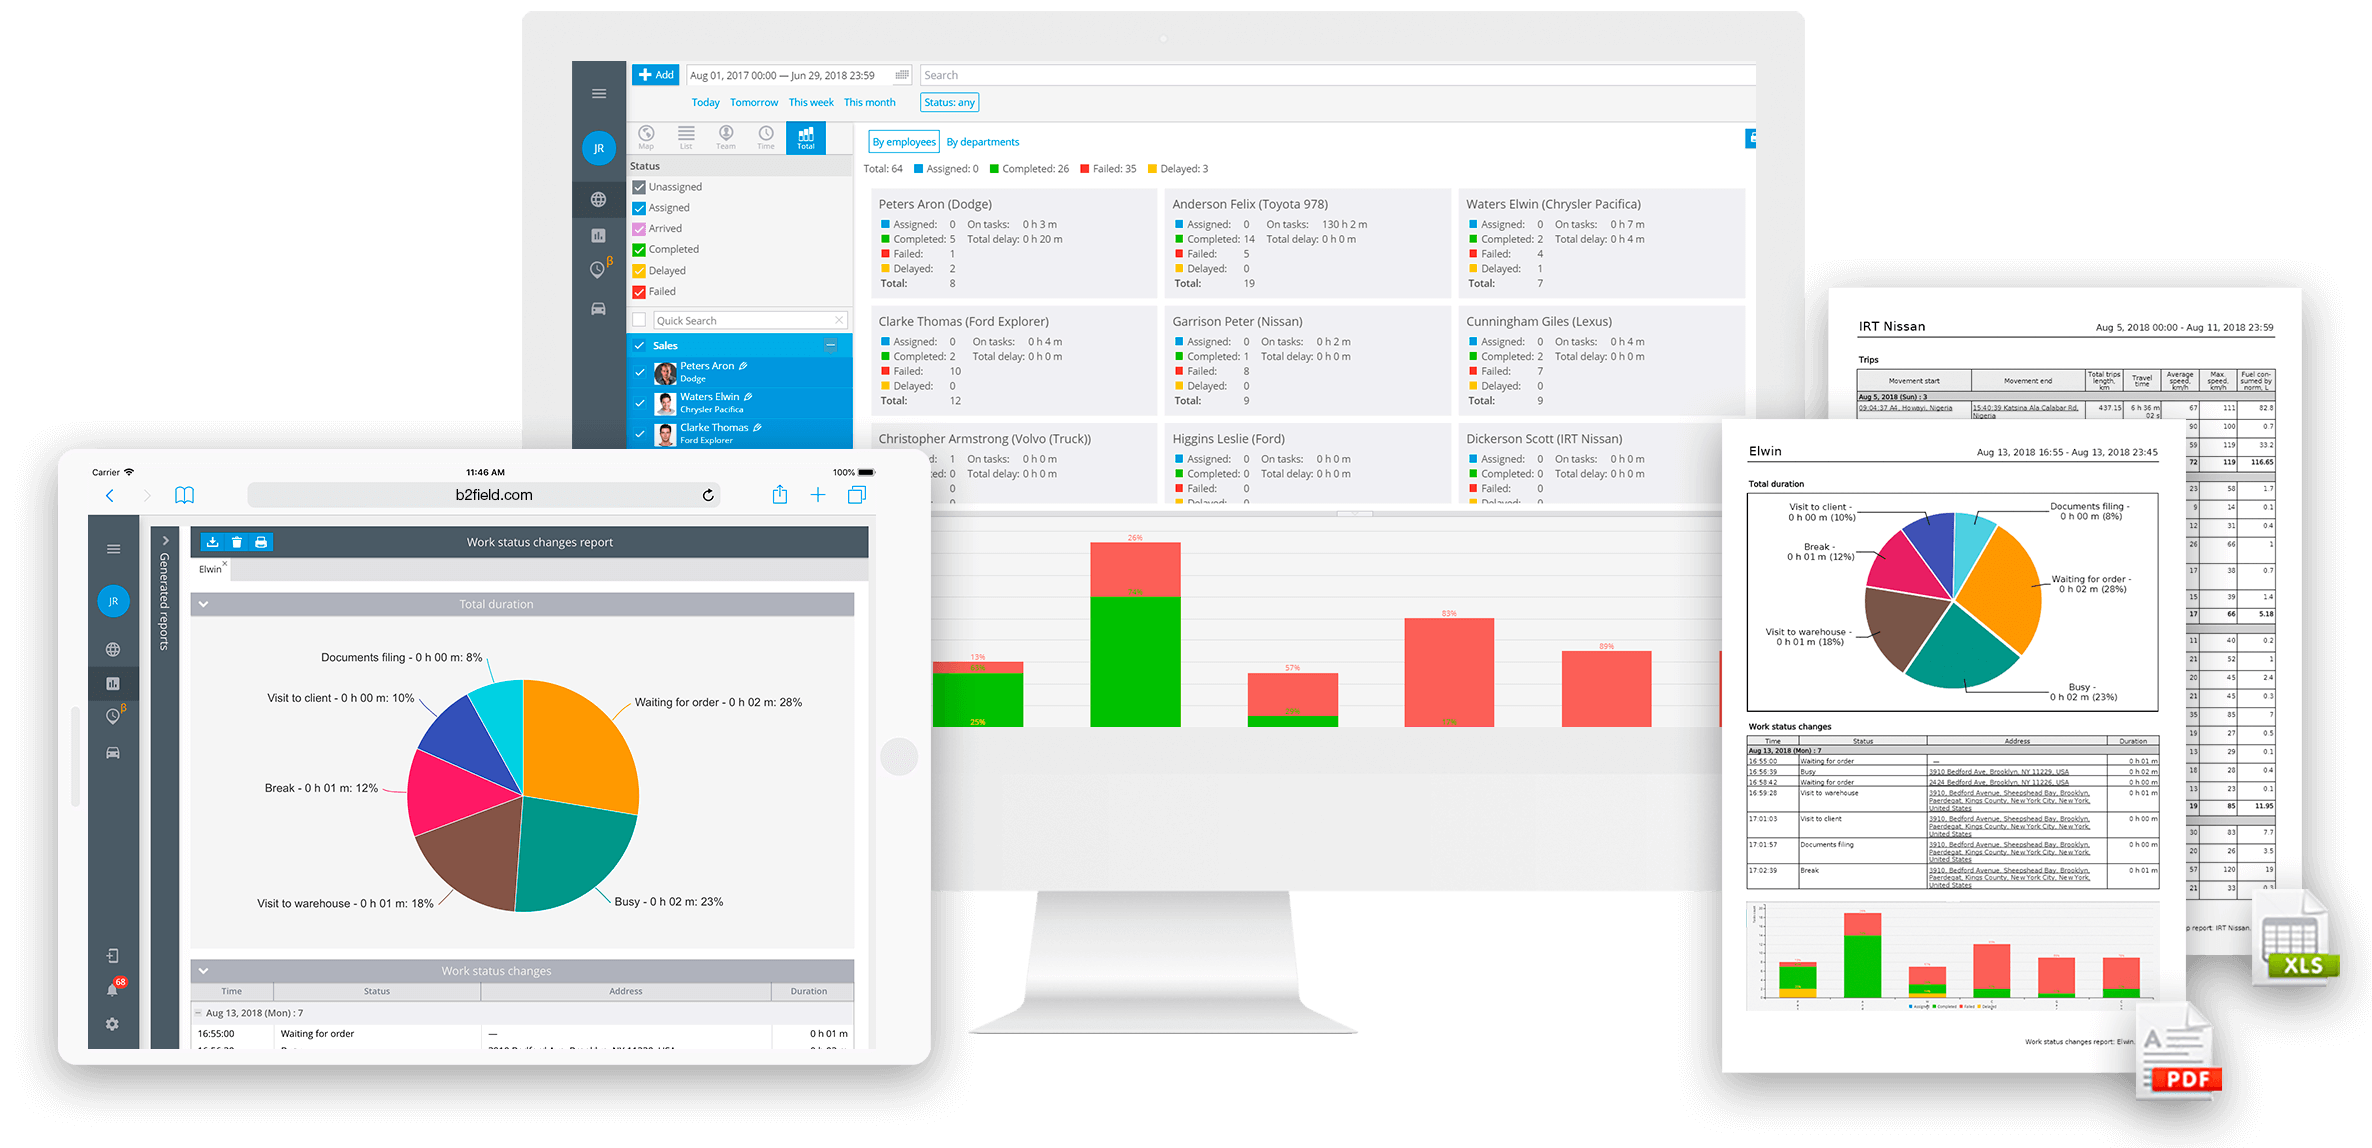
Performance Trends
Visualize key metrics over time to identify seasonal patterns and long-term improvements. Track performance month-over-month and year-over-year to ensure your strategies are delivering results.
Operational Efficiency
Break down time spent on tasks, travel, and idling to optimize workforce utilization. Identify bottlenecks in your daily operations and reallocate resources where they matter most.

Gut Feelings Don't Scale
Without accurate data, you're flying blind. Manual logs are unreliable, and "checking in" via phone wastes everyone's time. Navixy FSM automatically tracks everything — and turns it into reports you can act on.
How many jobs did each technician complete?
Stop guessing. See exact counts per employee.
Who is your most efficient driver?
Rank performance by objective metrics.
Are we overstaffed on Tuesdays?
Match workforce capacity to demand.
What You Can Measure
Comprehensive metrics across every aspect of your field operations.
- Jobs per day
- Average job duration
- On-time completion rate
- Miles driven
- Travel-to-work ratio
- Idle time
- Customer ratings
- First-time-fix rate
- SLA compliance
- Check-in/out times
- Hours worked
- Break compliance
- Fuel usage
- Mileage reimbursement
- Overtime hours
- Inspection pass rates
- Incident counts
- Custom field aggregates
Reports Library
Don't build from scratch. Use our library of pre-built templates designed for specific roles and industries.
Export Formats
Daily Activity Summary
Tasks completed, hours logged, check-ins per employee.
Weekly Productivity
Trend analysis across the team, top/bottom performers.
Mileage & Fuel
Distance driven, estimated fuel cost, route efficiency.
Customer Visit Log
Verified visits with times, durations, and outcomes.
Timesheet Report
Work hours per employee, overtime, discrepancies.
Form Submission Summary
Counts and data from inspection/delivery forms.
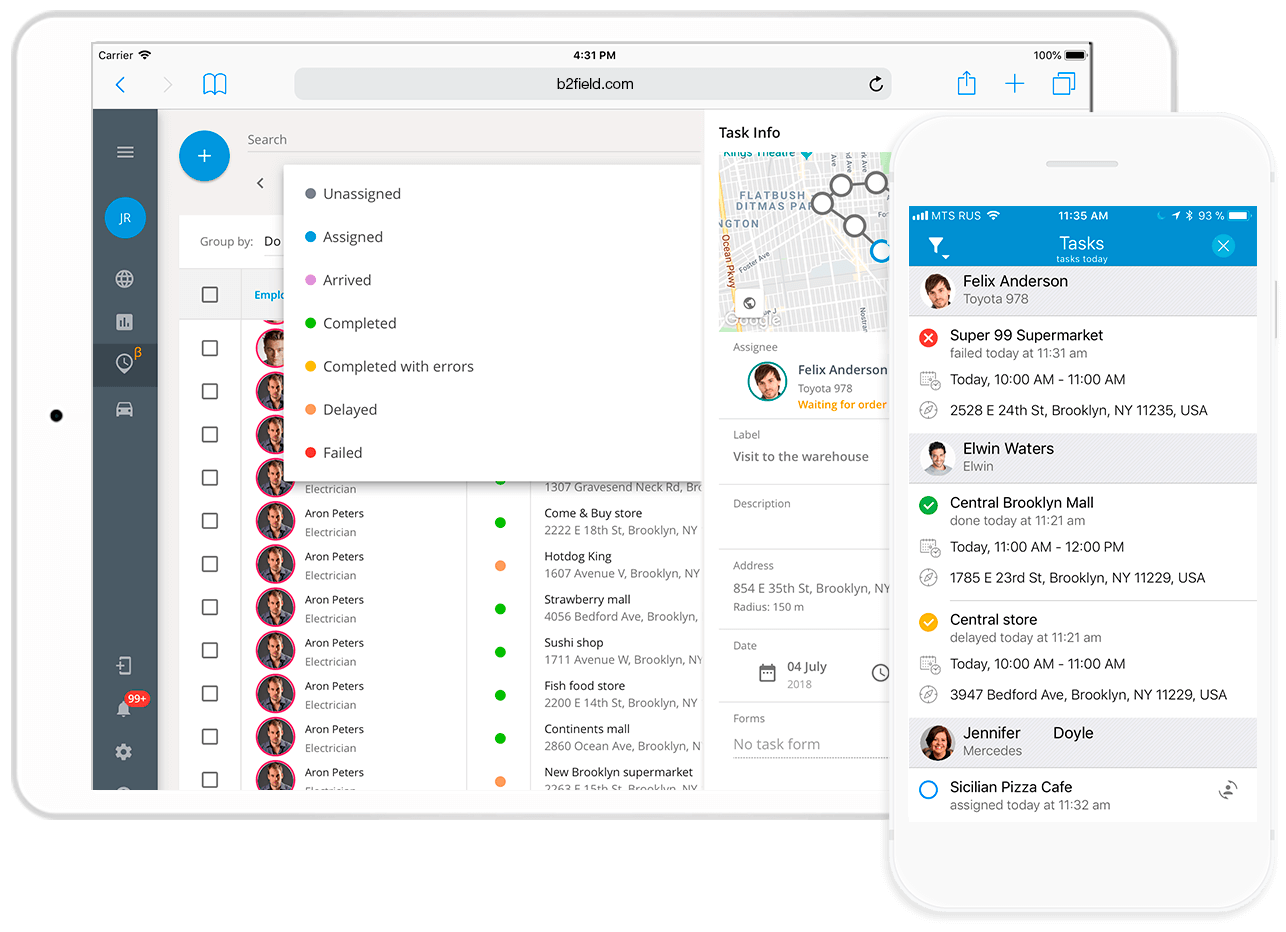
One Screen. Complete Picture.
The executive dashboard gives leadership a real-time view of field operations health — without digging through individual reports.
KPI Cards
Instant view of today's jobs, completion rate, and active workers
Trend Charts
Compare this week vs. last week performance at a glance
Map Overlay
Visual distribution of team locations and activity hotspots
Smart Alerts
Exceptions that need attention (late arrivals, SLA breaches)
Set It and Forget It
Schedule reports to run automatically and email to stakeholders. No manual export. No reminder to "run that report." It just arrives.
- Daily: Morning productivity summary to supervisors
- Weekly: Performance digest to operations managers
- Monthly: Executive summary to leadership
- On-Demand: Pull any report instantly when needed

Automated Delivery
Reports land in your inbox exactly when you need them.
How Teams Use Reporting
Real-world applications for better field management.
Performance Reviews
Replace subjective reviews with objective data. Use jobs completed, ratings, and punctuality scores for fair evaluations.
Resource Planning
Analyze workload by territory and time period. Identify understaffed regions and make hiring decisions with data.
Cost Optimization
Compare fuel usage against billable hours. Identify high-cost routes or inefficient drivers to justify optimization.

Data-Driven Culture
Empower your team with transparency.
Stop Guessing. Start Knowing.
Every task, trip, and form generates data. Navixy FSM turns it into insights — automatically. Make better decisions about your field operations.