How M2M commands in Navixy IoT Logic enable real-time device coordination

AuthorSvyatoslav I., Product Manager, Navixy IoT Logic
Your dashcam records a driver rubbing his eyes. Your tracker logs the location. Your platform displays an alert. And somewhere between these events and a meaningful response, minutes pass while an operator scrolls through a dashboard backlog.
This is the detection-reaction gap that defines most telematics deployments: devices that observe everything but act on nothing without human intervention.
Machine-to-machine commands are now available in IoT Logic, enabling telematics platforms to trigger automated responses across devices the moment events occur. Here's how it works and why it matters.
The gap between detection and reaction in telematics systems
A commercial vehicle today often carries more computing power than the dispatch center monitoring it. GPS trackers report location every few seconds. Dashcams analyze driver behavior through computer vision. Temperature sensors watch cargo conditions. Door sensors detect unauthorized access. Each device generates telemetry, and each telemetry stream feeds into a platform that records, visualizes, and alerts.
But recording and alerting are not the same as acting.
In most deployments, these devices operate as independent data sources. They share a vehicle but not a conversation. When a camera detects fatigue or a sensor registers a temperature spike, the platform's role ends at notification. Someone has to notice the alert, interpret its urgency, decide on a response, and manually trigger an action.
This dependency on human attention creates latency that ranges from seconds to hours depending on staffing, alert volume, and the operator's familiarity with the situation. Safety managers reviewing overnight alerts often start their day already behind, triaging low-priority notifications before reaching the critical ones. The detection happened in real time. The reaction did not.
How cross-device reactions typically happen today
Organizations that recognize this gap have developed workarounds, each with its own trade-offs.
- Manual intervention remains the default. An operator sees an alert, assesses the situation, and sends a command or makes a call. This works for routine events but fails when response time matters or when the operator is unavailable.
- External API integrations forward telemetry to third-party systems that process events and return commands. The telematics platform becomes one node in a larger architecture, passing data outbound and receiving instructions inbound. Each hop adds latency and each integration requires maintenance.
- Middleware platforms sit between data sources and action systems, applying business logic to incoming events. These platforms can be powerful but introduce another vendor, another interface, and another failure point into the operational stack.
- Custom development builds purpose-specific services that subscribe to telematics events and trigger responses. This offers maximum control at the cost of engineering resources and ongoing maintenance.
Each approach adds architectural complexity. Data must travel further. More systems must stay synchronized. More credentials must be managed. And at the end of this chain, a command finally reaches the device that could have responded immediately if only it had been told.
What if the reaction could happen inside the telematics platform itself?
Device-to-device commands and the role of IoT Logic
IoT Logic is a visual logic builder within the Navixy platform that enables event-driven automation without external middleware or custom code. Instead of forwarding telemetry elsewhere for processing, IoT Logic evaluates incoming data directly and triggers actions based on configurable conditions.
The architecture follows a straightforward pattern: data arrives from a device, passes through evaluation nodes that test conditions, and when conditions match, an Action Node executes a response. That response can include sending a command to another device on the same account.
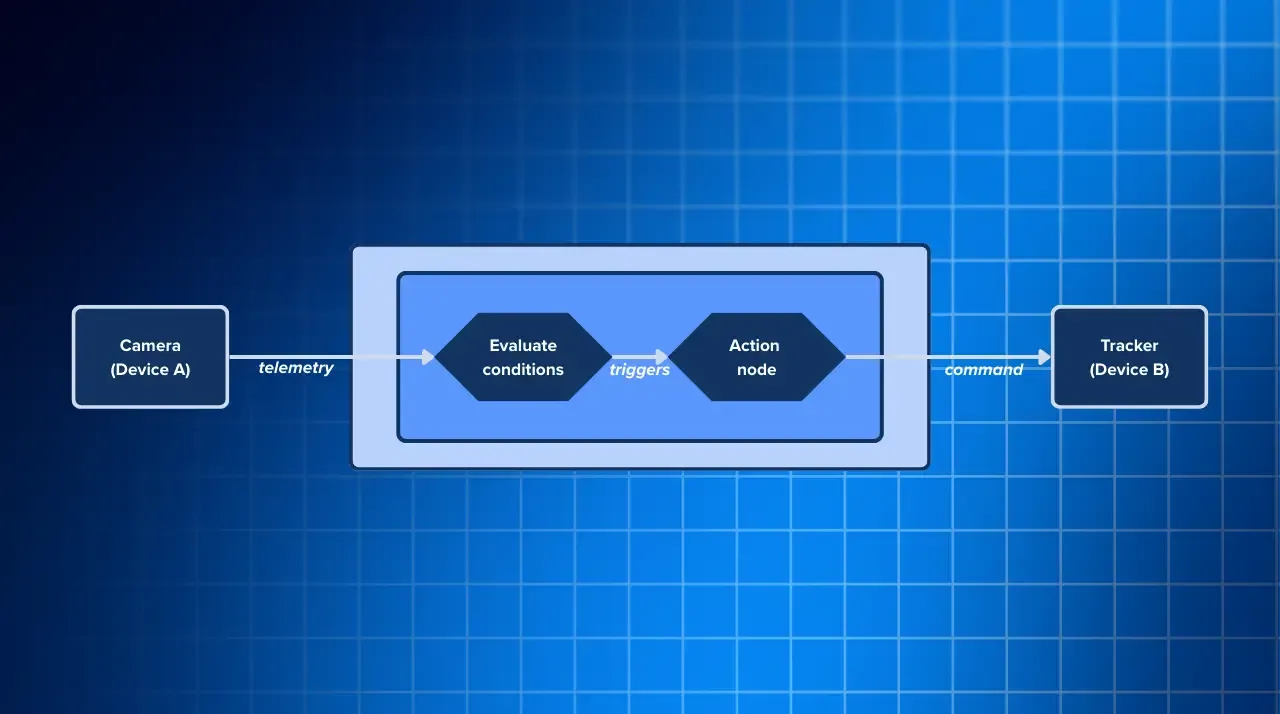
This is the mechanism behind machine-to-machine commands. A camera generates a fatigue event. IoT Logic evaluates the event code. If the code matches the configured condition, the platform sends a command to a tracker in the same vehicle, activating a buzzer connected to its digital output. The entire sequence happens within the platform boundary, with no external API calls, no middleware processing, and no operator involvement.
The Action node supports various command types depending on the target device's capabilities. Digital outputs can activate external accessories. Configuration commands can adjust device behavior. The specific options depend on what the device protocol supports, but the pattern remains consistent: evaluate telemetry, match conditions, trigger commands.
For teams already familiar with data processing with IoT Logic, the Action node extends the same visual workflow to include device control, not just data transformation.
The architectural distinction matters beyond convenience
In a typical deployment, a telematics platform collects data and presents it. Automation requires external systems. Events flow out through webhooks or APIs, processing happens elsewhere, and commands flow back in through separate integrations. Each boundary crossing adds latency, typically measured in seconds at best, and each integration point requires authentication, error handling, and monitoring.
With event-driven automation built into the platform, the detection-to-action loop stays internal. Telemetry arrives, evaluation happens, and commands dispatch within the same processing context. No network round trips to external services. No credential exchanges. No middleware availability dependencies.
This does not eliminate all complexity. IoT Logic requires configuration. Conditions must be defined correctly. Device capabilities must be understood. But the complexity concentrates in setup rather than runtime. Once configured, the automation executes reliably because it depends only on the platform and the devices, not on the availability of external services.
The practical result is faster reactions. When a safety event occurs, the response begins in milliseconds rather than waiting for data to traverse an integration chain.
Illustrative scenario: driver fatigue detection and automatic warning
Consider a fleet where driver monitoring cameras detect fatigue-related behaviors: eyes closing, yawning, head nodding. In a conventional setup, these detections generate events that appear in the platform interface. A safety manager monitoring the dashboard might notice the alert and contact the driver or dispatcher. But if the manager is reviewing other vehicles, attending a meeting, or simply not watching at that moment, the driver receives no immediate feedback.
With machine-to-machine automation, the sequence changes. The camera detects fatigue and sends its telemetry to the platform. IoT Logic evaluates the incoming data and recognizes the fatigue event code. Without waiting for human review, the platform sends a command to the vehicle's GPS tracker. The tracker activates its digital output, which is wired to an in-cab buzzer. The driver hears the warning within seconds of the detection.
The safety team can still review the event. The alert still appears in the dashboard. But the immediate response no longer depends on someone noticing it first.
Real implementation: Howen MDVR and Teltonika FMB920 integration
This scenario is not hypothetical. One fleet deployment uses exactly this configuration to deliver automated fatigue warnings.
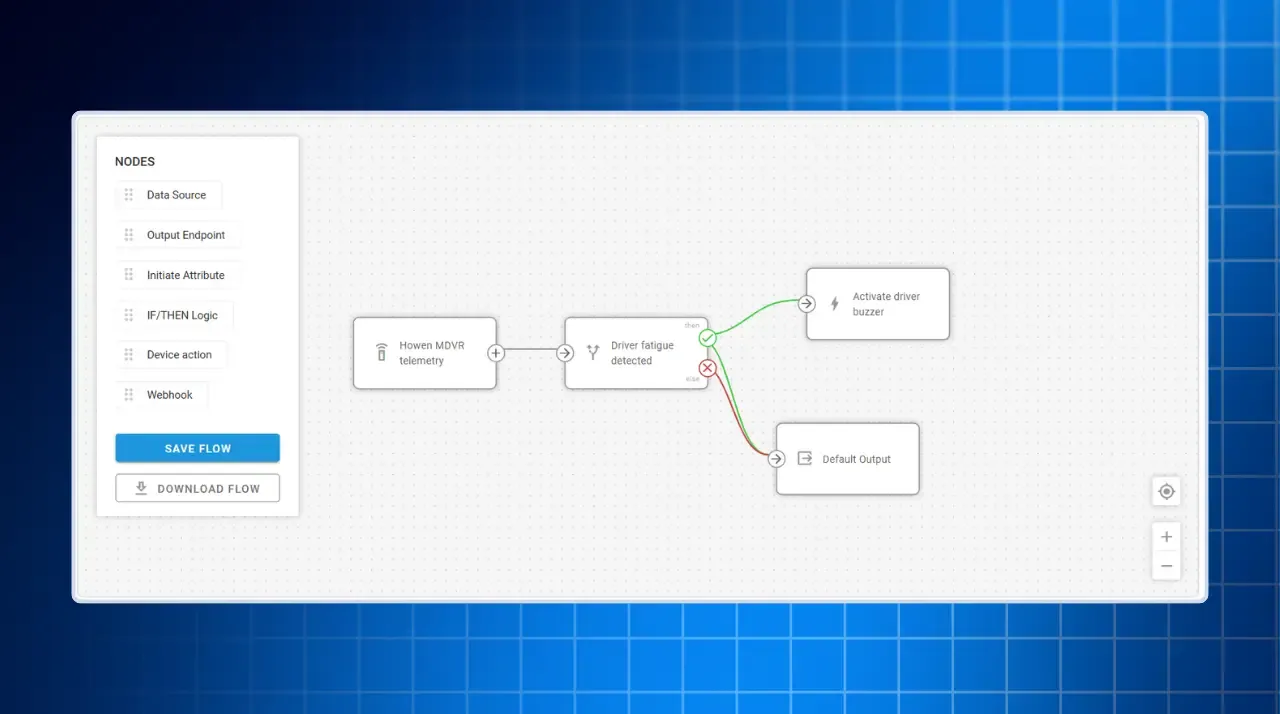
The setup combines a Howen MDVR camera system with a Teltonika FMB920 GPS tracker. The Howen camera performs driver status monitoring (DSM), detecting behaviors including fatigue, distraction, phone use, and eyes closed. When it detects a fatigue event, it generates telemetry with specific event codes that identify the behavior type.
IoT Logic receives this telemetry and evaluates the DSM event data. When the fatigue event code appears, a configured rule triggers the Action Node. The Action Node sends a digital output command to the Teltonika FMB920 tracker installed in the same vehicle.
The FMB920 has one digital output that can control external accessories. In this deployment, a buzzer is wired to that output. When the tracker receives the command from IoT Logic, it activates the output, and the driver hears an audible warning.
The entire chain, from camera detection to buzzer activation, happens without dispatcher involvement. The platform handles the coordination. The devices handle the physical response. And the driver gets an immediate alert that might prevent a more serious incident.
Broader applications across industries and roles
The fatigue-to-buzzer example demonstrates a safety application, but the underlying mechanism applies wherever cross-device coordination adds value.
- Fleet safety teams can extend the pattern beyond fatigue. Distraction events from cameras can trigger similar warnings. Harsh driving events from trackers can activate dashboard indicators. Speeding in geofenced zones can prompt immediate audio alerts rather than after-the-fact reports.
- Logistics operators managing cargo conditions find similar opportunities. A temperature sensor detecting excursion outside acceptable range can trigger a command to a connected refrigeration controller. A door sensor detecting unauthorized access can activate a tracker's buzzer or trigger a camera snapshot.
- Cold chain operations, where temperature deviations can destroy entire shipments, benefit from reactions measured in seconds rather than minutes. Equipment monitoring scenarios, where machinery entering critical states needs immediate attention, follow the same logic.
- Field operations managers overseeing distributed assets can configure automated responses to sensor thresholds, reducing the monitoring burden while maintaining operational awareness.
The common thread across these applications is replacing manual intervention with configured automation. The platform holds the logic. The devices execute the responses. The operators focus on exceptions that genuinely require human judgment.
Conclusion: the operational value of device-to-device automation
Telematics platforms have long excelled at collection: gathering data from devices, storing it reliably, and presenting it through dashboards and reports. Machine-to-machine commands represent a shift toward platforms that also act, triggering coordinated responses without routing events through external systems or waiting for human attention.
This capability now exists within IoT Logic. Configuration is required, not magic. But once configured, the automation delivers what integration chains cannot: immediate reactions that stay inside the platform boundary.
For both telematics service providers and fleet operators, this means simpler architectures, faster responses, and operational models where the urgent events get addressed first, automatically.
If you see potential for machine-to-machine commands in your operations, or want to understand how this capability applies to your specific device combinations, book a demo to discuss your requirements. For technical details on IoT Logic configuration and device command support, explore the Navixy documentation.