Custom reports in Navixy: get operational control without external BI

AuthorKirill E., Navixy Data Analyst
We pay close attention to how enterprise fleets operate and where rigid, prebuilt fleet analytics constrain strategic decision-making. That’s why we continue to evolve Dashboard Studio and introduce custom telematics reports as a powerful extension to custom dashboards. In this article, you’ll see how this new capability unifies SQL logic, visuals, and geospatial data into one live view.
Key takeaways:
- Adopt custom telematics reports in Dashboard Studio to centralize fleet analytics and eliminate fragmented reporting and BI dependencies.
- Accelerate decisions with real-time telematics refresh and synchronized table, chart, and map views.
- Reduce operational risks by detecting inefficiencies, route deviations, and performance anomalies faster.
- Deliver stakeholder-ready reports in Excel, HTML, or PDF without rebuilding analytics or reworking data.
Fleet data is rarely the problem. You already collect GPS, engine, and driver data every second. But when fleet analytics operate rigid analytics inside fragmented systems, business processes lose speed and clarity. Using custom telematics reports in Dashboard Studio — a fleet analytics app built on top of IoT Query — centralizes logic and visualization, decision cycles shorten and cost control improves. The difference is measurable in fuel savings, compliance accuracy, and operational transparency.
Let’s break down what makes these custom reports in Dashboard Studio powerful for personalized fleet analytics.
What are custom reports in Dashboard Studio
Custom reports are SQL-driven analytical views that combine structured data, visual trends, and geospatial context into one synchronized report available directly in Navixy. They allow fleet analytics teams to query telematics data directly and immediately visualize results without exporting or rebuilding logic elsewhere.
In practical terms, one SQL query powers three entities: a table, a chart and a map. This approach eliminates discrepancies between numbers and visuals which is a critical requirement for business reporting and compliance.
Table: structured operational visibility
The table component transforms raw telematics output into a structured operational dataset, enabling precise fleet analytics at scale:
- Automatically detect columns from your SQL query.
- Limit visible rows (for example, 25) to maintain interface performance.
- Download the full dataset regardless of visualization limits.
From a business perspective, this matters because operations managers often need two things simultaneously: fast on-screen summaries and complete datasets for audit, billing validation, or compliance checks. Custom reports provide both without rebuilding queries.
There is also an optional coordinate-to-address conversion. This feature replaces latitude and longitude with actual addresses.
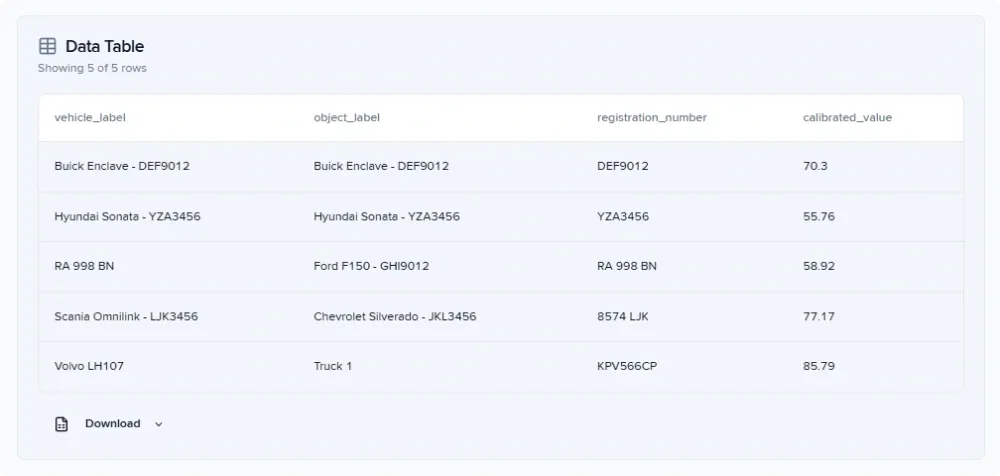
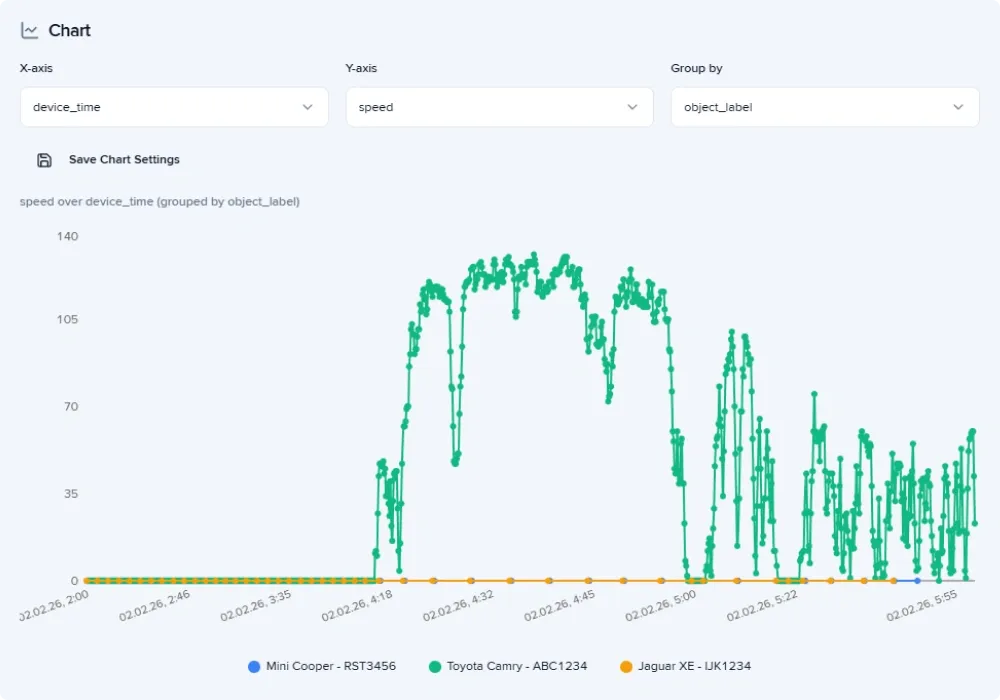
Chart: trend analysis for fleet analytics
The chart component converts telematics data into time-based or categorical visual patterns, making fleet analytics interpretable at a glance. You can select the bar (column) chart or time series (line) chart. This is where custom reports move from monitoring to management, giving you a clear picture of:
- Speed patterns across vehicles
- Route adherence and geo-based deviations
- Performance inefficiency over time The business outcome is straightforward: faster identification of inefficiencies such as idle time, unauthorized usage, or route deviations.
Map: geospatial validation of operational data
The map component in custom telematics reports adds spatial intelligence to custom reports, completing the fleet analytics picture. If GPS coordinates are present, the system automatically detects them and reconstructs movement paths. The geographic context is especially important for logistics, field service, or construction fleets. It helps to reduce dispute resolution time, improve SLA adherence, and strengthen compliance documentation.
How to get a live telematics report
Custom reports in Dashboard Studio support real-time refresh through the underlying SQL logic, ensuring fleet analytics reflect the current operational state. Instead of waiting for scheduled exports or BI sync cycles, teams can refresh data in one click.
Operational impact is immediate for each team member:
- Dispatchers see updated asset movement.
- Analysts validate new data without rebuilding the report.
- Managers monitor current performance indicators.
For large enterprise fleets, real-time telematics reporting becomes a financial control mechanism rather than a technical feature.
If you are interested in building custom dashboards, explore the blog post to learn more about Dashboard Studio opportunities.
How quickly deliver the exact fleet report each department needs
Custom telematics reports in Dashboard Studio support multiple export formats, each aligned with a different stakeholder need. By delivering the right format to the right department, custom reports reduce reporting friction, eliminate data conflicts, and accelerate enterprise-level decisions.
Excel: full dataset for advanced analysis
For finance or compliance teams, Excel still remains the operational standard. Providing complete dataset directly from custom reports reduces manual data preparation and eliminates discrepancies between departments.
HTML: interactive analytics for operational managers
Saving a report as HTML preserves interactivity. This format is ideal for regional managers or operational supervisors who need exploratory access without SQL knowledge. The exported file includes: the complete data table, interactive charts with hover details, a zoomable, interactive map.
PDF: static executive documentation
PDF ensures the report reflects a specific data state, which is critical for compliance and governance. This static and clear format of custom report can be used for board-level reporting, regulatory documentation, as well as for official record archiving.
Watch the video to learn how quickly deliver the exact fleet report each department needs.
How to turn custom telematics reports into operational advantage
Custom reports in Dashboard Studio are not just visualization components. They are structured fleet analytics instruments that deliver measurable business value:
- Faster detection of inefficiencies and idle time
- Clear geospatial validation of incidents and route deviations
- Real-time operational visibility without external BI dependencies
- Consistent, audit-ready reporting across departments
If your team is still exporting data, reconciling conflicting dashboards, or rebuilding the same report logic across tools, it is time to centralize fleet analytics inside one environment. Contact sales to enable IoT Query and start building custom reports in Dashboard Studio free of charge.