How to control actual work on heavy machinery fleets in Navixy

AuthorNenad K., Technical Solutions Engineering Manager
Equipment that barely moves still burns fuel, accumulates engine hours, and occasionally disappears. But the harder question, the one that determines whether your fleet is earning its keep, is whether that equipment is actually working.
Consider a 450-vehicle fleet spread across remote construction sites. Of those, 120 are heavy machinery: excavators, loaders, dozers. Every month, the operations team reviews engine hours, but to what end? An excavator showing 180 hours could have spent 150 of those idling while the operator waited for trucks. Or it could have been digging at full capacity for six weeks straight, quietly accelerating toward a $40,000 hydraulic pump failure.
The visibility gap in heavy machinery fleet operations
Standard GPS tracking inside a telematics platform answers the “where” question reasonably well. You can see that an excavator is at the quarry, not the unauthorized project across town. You can verify it arrived at 7 a.m. and left at 4 p.m. But this is like knowing an employee showed up at the office without knowing how they spent the day.
Heavy machines operate across a spectrum of intensity:
- An excavator idling between loads runs its engine at roughly 800 to 1,100 RPM.
- The same machine actively digging trenches or loading trucks operates between 1,650 and 2,200 RPM.
- Between those extremes lies moderate work, the 1,100 to 1,650 RPM range where the machine is engaged but not at full capacity. These thresholds vary by equipment model. Manufacturers publish these specifications, but few tracking systems use them.
For operations managers, this gap creates real problems. You cannot rotate equipment effectively if you don't know which machines are absorbing the heaviest loads. You cannot predict maintenance needs. And you cannot hold operators accountable for performance.
How RPM-based workload tracking works
The technical challenge is extracting RPM data from machines that were never designed to share it. Modern heavy equipment with CAN-bus capability can provide direct access to engine data, including RPM. The GPS tracking device reads this information through the diagnostic port, much like reading vehicle data from a car's OBD-II connector.
Legacy equipment predates these standards. This setup takes effort, especially on legacy equipment, but it’s a one-time step.
Once the data is available, it’s translated into simple workload categories — for example, light, medium, and heavy operation based on RPM ranges. These thresholds are defined per machine type, so the data reflects how each asset is actually designed to work.
What matters is not how RPM is captured, but what it enables: a consistent way to understand how hard each machine is working across the fleet.
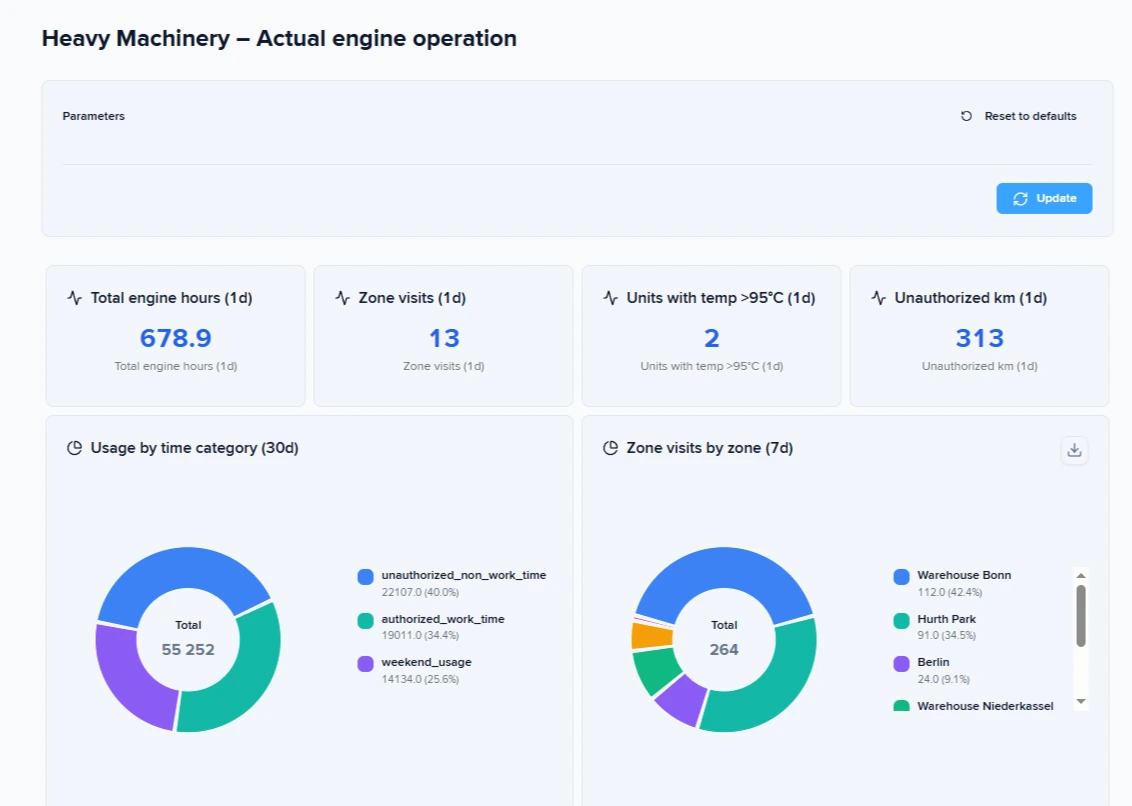
What each dashboard metric reveals about your operation
Raw workload states become useful when aggregated into a specific dashboard, as presented in the Dashboard Studio, which answers operational questions.
Example
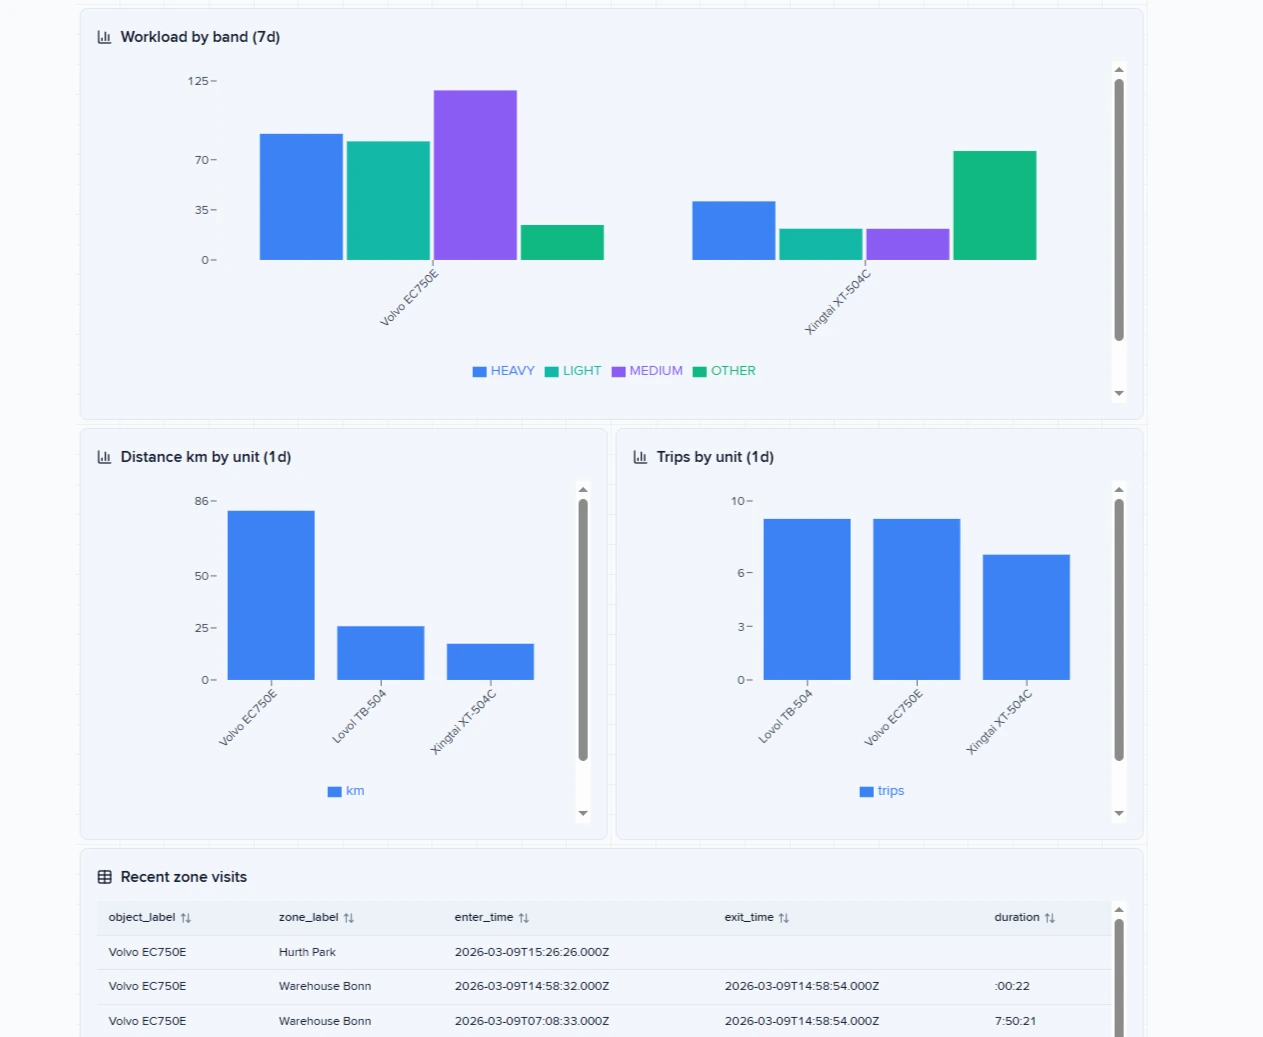
Consider engine hours broken down by workload band. If Machine A logged 150 hours last month with 90 of those in Heavy Work mode, while Machine B logged the same 150 hours with only 25 in Heavy Work. Machine A is aging faster: its hydraulic system, drivetrain, and engine components are experiencing more stress per operating hour than the report initially suggested.
Maintenance planning matters. Interval-based maintenance, the traditional "service every 500 hours" approach, treats all hours as equal. However, a machine that spends 60 percent of its time in Heavy Work mode should be serviced more frequently than one doing mostly light duty. Some operations use workload data to adjust service intervals dynamically, reducing the risk of unexpected breakdowns on machines absorbing the hardest work.
Zone visit reports verify that equipment stays where it belongs. Heavy machinery is valuable and mobile. A loader assigned to Site A should not be appearing at Site B unless someone authorized the transfer. Geofenced zones combined with entry and exit timestamps provide accountability without requiring constant manual checks.
Unauthorized kilometers work similarly. Tracked distance outside approved areas indicates potential misuse or, at minimum, operational decisions that bypassed the dispatch process. For fleets where fuel theft or unauthorized side jobs are concerned, this metric provides early warning.
Usage time categories, distinguishing work hours from non-work hours and weekend operation, reveal patterns that basic engine hour reports miss. Equipment running at 2 a.m. on a Sunday raises questions. Sometimes the answer is legitimate overtime. Sometimes it is unauthorized use that the operations team would never discover without the data.
Operator identification through RFID ties machine usage to specific individuals. This enables performance comparison across operators and provides accountability when problems arise. Some implementations use an audible buzzer rather than an engine immobilizer, alerting the operator in the machine as well as supervisors to unauthorized operation without creating safety risks from sudden shutdowns.
The combination of these metrics, available through dashboard templates designed for heavy machinery, gives operations teams visibility they could not achieve through periodic site visits or end-of-shift reports. The data exists continuously, even when the equipment operates in locations too remote for regular oversight.
Turning data into decisions: the equipment rotation strategy
Visibility without action is expensive entertainment. The value of workload analytics emerges when operations teams use the data to make different decisions than they would have made otherwise.
Example
Equipment rotation is the clearest example. Group reports sorted by Heavy Work hours reveal which machines need relief. If three excavators on the same project show dramatically different Heavy Work percentages, the operations team knows to rotate them. The high-exposure machine moves to lighter duty. A machine that has been coasting takes on more intensive work. Over time, this balancing extends the lifespan of the entire fleet.
The alternative is discovering equipment degradation through failure. A hydraulic pump that wears out early because one machine consistently absorbs the hardest assignments costs far more than the few hours required to rotate equipment proactively.
Driver performance dashboards add another dimension. When operators work multiple machines, their aggregate performance becomes visible. An operator who consistently logs higher Heavy Work percentages on every machine they touch may be working harder than peers, or may be operating equipment more aggressively than necessary. Some fleet operators tie this data to performance management.
Implementation realities: what it takes to deploy this system
Heavy machinery installation is demanding work. Legacy equipment requires manual sensor setup, experienced technicians, and careful planning to avoid downtime — especially across remote sites and double-shift operations.
This is not plug-and-play. It requires coordination, calibration, and input from your team and investment from you. Once deployed, the system delivers continuous visibility into how equipment is actually used — not just whether it’s running.
From operational blindness to data-driven control
How much visibility do you currently have into how your heavy machinery is actually used? If the answer involves engine hours alone, the gap between what you track and what matters is larger than it appears. Workload analytics built on RPM data closes that gap, converting raw sensor signals into the operational intelligence that heavy machinery management requires.
Contact us to connect IoT Query and start using Dashboard Studio for free.
Frequently Asked Questions
Question: How do you get RPM data from older machines without CAN-bus?
Answer: For machines without CAN-bus, the solution involves pulse sensors connected to the alternator's W-wire. This wire produces an electrical signal whose frequency correlates with engine speed. With proper calibration, pulse counts convert to RPM values.
The calibration step matters as different alternators produce different pulse-to-RPM ratios, and environmental factors affect signal quality. Implementation teams working with heavy machinery often spend significant time locating the W-wire on older machines and routing cables through tight spaces designed for hydraulics rather than electronics.
Once RPM data flows into the tracking platform, the transformation into actionable insight happens through conditional logic. IoT Logic, for example, allows for the configuration of virtual sensors that convert raw RPM into named states. When the engine runs between 800 and 1,100 RPM, the system records Light Work. Between 1,101 and 1,650 RPM becomes Medium Work. Above 1,650 RPM registers as Heavy Work.
These thresholds must be configured per machine model, using the manufacturer's documentation. A fleet operator working with their telematics provider supplies these values, ensuring that a "Heavy Work" reading on a compact excavator means the same thing as one on a mining loader: the machine is operating at the upper end of its designed capacity.
Question: What are the practical challenges during deployment?
Answer: Technicians locating alternator W-wires on aging equipment and routing cables through machines designed without electronics in mind report that only the most experienced teams complete these jobs successfully.
Access to machines operating in remote areas requires logistical coordination. Equipment that works double shifts cannot be offline for installation without advance planning. And the RPM threshold values that make the system meaningful come from the client's engineering documentation, not from the tracking provider.
Question: How accurate is RPM-based workload classification in real operations?
Answer: Accuracy depends on correct threshold configuration and signal quality. When RPM ranges are defined using manufacturer specifications and validated during deployment, workload classification reflects real operating conditions with high reliability.
However, misconfigured thresholds can distort insights. For example, if the "Heavy Work" range is set too low, normal operation may be misinterpreted as intensive use. That’s why calibration and initial validation with real usage data are critical steps before relying on reports for decision-making.
Question: Do you need constant connectivity for workload tracking to work?
Answer: No. Modern GPS tracking devices buffer data locally when connectivity is unavailable. This is especially important for heavy machinery operating in remote areas such as quarries, construction sites, or mining zones.
Once the device reconnects to the network, it uploads stored data to the platform, ensuring that workload history remains complete. This allows operations teams to maintain continuous visibility even in regions with unstable or limited coverage.
On this page
- The visibility gap in heavy machinery fleet operations
- How RPM-based workload tracking works
- What each dashboard metric reveals about your operation
- Turning data into decisions: the equipment rotation strategy
- Implementation realities: what it takes to deploy this system
- From operational blindness to data-driven control
- Frequently Asked Questions