How a system integrator built a sensor app with IoT Query, not APIs

AuthorAndrew M., VP of Data and Solutions
A warehouse supervisor searches a fleet management dashboard for temperature readings buried three clicks deep. The data is there, but the interface is built for dispatchers, not cold storage operations. This mismatch between platform capabilities and business needs is common. Building custom applications typically takes months, but this case study outlines a faster path.
Key takeaways
- Build custom monitoring apps faster with direct access to telemetry, eliminating the need for middleware and complex data pipelines.
- Simplify analytics development by using SQL to query historical data directly, avoiding the overhead and limitations of API-based integrations.
- Create role-specific dashboards with flexible SQL queries that align closely with operational workflows, improving usability and decision-making.
- Scale seamlessly across warehouses and users, without rebuilding infrastructure or managing API constraints.
- Accelerate time-to-value by focusing on analytics and insights through SQL, rather than maintaining backend services or API integrations.
Explore IoT Query to unlock the full potential of your telematics data for custom analytics applications.
The operational reality of specialized monitoring
General-purpose telematics platforms excel at what they were designed for: vehicle tracking, route optimization, driver behavior analysis. But when a logistics company needs environmental monitoring across multiple warehouse rooms, the same interface becomes an obstacle.
The supervisors in this case needed something specific:
- Temperature and humidity readings across 12 storage zones.
- Historical trends for incident investigation.
- A highlight when conditions drift outside acceptable ranges.
Traditionally, solving this problem required one of two paths: stretching APIs and existing platforms beyond their intended purpose, or building a separate application stack with custom pipelines, infrastructure, and role management. Both approaches introduce unnecessary complexity. The first leads to integrations and limited flexibility for analytics. The second slows down delivery, as teams spend weeks and months assembling data pipelines, maintaining infrastructure, and reconciling multiple data sources instead of generating value.
The challenge: balancing independence with integration
The system integrator faced a requirements list that looked straightforward but carried architectural implications. Sensors were already deployed across the warehouse network, feeding telemetry into Navixy. Temperature, humidity, door states, and equipment runtime data flowed continuously.
But the supervisors needed an interface showing only what mattered to their workflow:
- Real-time status at a glance.
- Historical queries for investigating why the freezer in Zone 3 showed a temperature spike last Tuesday.
- Customer-specific views for clients who wanted visibility into their dedicated storage areas.
The application also needed to remain independent, a focused tool for warehouse operations, while staying connected to the telematics platform. New warehouses and sensors should integrate without rebuilding the application. User permissions should respect the existing organizational structure.
Scalability meant three things: more rooms within a warehouse, more warehouses across the network, and more users with different permission levels. The architecture had to support all three without requiring custom development for each expansion.
Architectural decision: why direct data access outperformed the API approach
Two architectural paths led to a working application. The first, using the platform API, is the conventional choice. The second, direct access through IoT Query , offered a different trade-off.
The API approach works well for many integrations. For real-time status dashboards, this pattern delivers results quickly. But historical analytics change the equation. Querying six months of temperature data across 12 zones through an API means pagination, rate limiting, and data aggregation logic that lives in custom middleware. The integrator would need to build and maintain a local database, synchronization routines, and storage infrastructure, all before writing a single line of dashboard code.
IoT Query offered a different architecture. The application queries a prepared data layer directly using standard SQL.
"IoT Query gives ready-to-use access to real-time and historical telemetry data without the necessity of building storage and aggregation layers," explains Andrew Melnik, Navixy VP of Data and Solutions. "SQL queries run faster than repeated API calls would allow. As a result we can serve real-time dashboards and historical analytics from the same data source, which keeps the architecture straightforward. The application remains independent but integrates cleanly with the Navixy. Particularly for this use case, the maintenance burden is dramatically lower than the API alternative."
Implementation: from database access to operational dashboards
With the architectural decision made, implementation focused on what system integrators do best: building applications that solve specific problems.
IoT Query raw data layer provided the foundation. This dataset contains telemetry readings with the structure and indexing needed for time-series analysis. Temperature readings, humidity measurements, door states, and equipment status, all queryable through standard SQL syntax compatible with PostgreSQL tooling.
The development pattern looked familiar to anyone who has built analytics applications:
- Connect to the data source.
- Write queries for the specific metrics needed.
- Build visualizations that answer operational questions.
For real-time monitoring, the application queries recent readings and updates dashboards at intervals appropriate for environmental conditions (minute-level changes matter less than hour-level trends for cold storage). For historical analysis, the same data source supports queries spanning weeks or months without the pagination complexity of API.
Customer isolation came through the existing organizational structure. Each warehouse client sees only their designated storage zones. The application respects these boundaries without requiring custom access control logic.
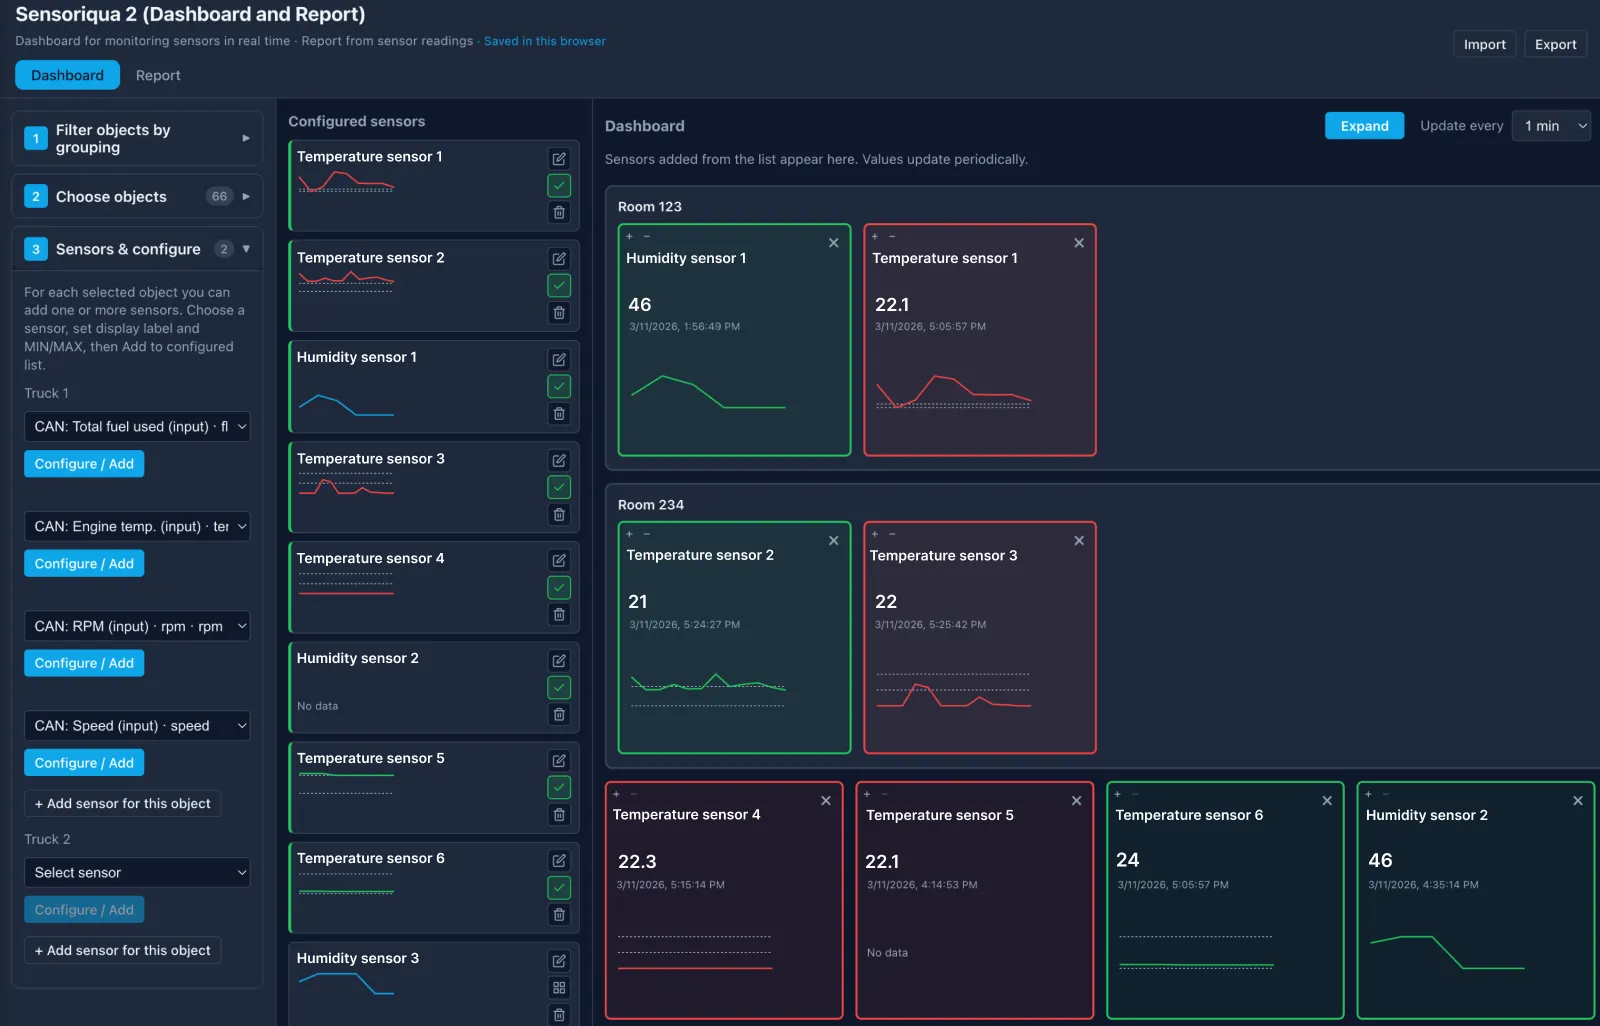
The delivered application gives supervisors exactly what they need:
- Real-time environmental status across all monitored zones.
- Historical trend charts for investigating anomalies.
- Threshold-based alerts when conditions exceed acceptable ranges.
- Customer-specific views with appropriate data isolation.
The application runs as an independent tool but opens from within the Navixy interface, maintaining a coherent experience for users who work across both fleet and warehouse operations.
This integration is enabled through App Connect, Navixy’s authentication tool. It transfers user authentication from the platform to the external application, allowing users to access the monitoring tool without separate logins. For system integrators, this removes the need to build or maintain authentication infrastructure.
What comes next: from monitoring to prediction
As the application scales, additional KPIs can extend the dashboard beyond temperature and humidity. Metrics like equipment runtime, energy consumption, and maintenance indicators can be seamlessly integrated using the same data layer.
Predictive analytics represent the next operational improvement. Instead of alerting when conditions exceed thresholds, the system can identify patterns that precede failures. A compressor that cycles more frequently than normal. A door sensor showing unusual open durations. These signals exist in the historical data, waiting for analysis.
Alerting mechanisms will move beyond the application itself. Integration with operational workflows ensures the right people receive notifications through their existing channels (email, messengers), while allowing alerts to be reduced or removed when needed.
Mobile interfaces will extend access to supervisors during facility walks. The same queries that power desktop dashboards can drive focused mobile views showing zone status and recent alerts.
The foundation matters because these expansions require minimal architectural changes. The data layer already contains the signals needed for more sophisticated analysis. Building additional views and analytics becomes application development, not infrastructure work.
The case for a data-first approach
This case study illustrates a principle that applies beyond warehouse monitoring: when the data infrastructure is handled, system integrators can focus on applications that solve real problems. A prepared data layer enables developers to query structured telemetry via standard SQL — without managing underlying systems.
For system integrators, this is an architectural advantage. With built-in support for time-series analysis and multi-tenant environments, a ready data layer can reduce delivery from months to weeks.
Contact us to enable IoT Query and unlock the full potential of your telematics data for custom analytics applications.
Frequently Asked Questions
Q: What specific middleware components would an API-only approach require?
A: API approach requires pagination handling, rate limit management, local database storage, synchronization routines, and aggregation logic before dashboard development can begin.
Q: How do API rate limits and pagination affect historical data analysis at scale?
A: Historical queries spanning months of data across multiple zones would require extensive pagination handling and would be constrained by API rate limits, making real-time historical analysis impractical.
Q: How does IoT Query handle inconsistent or noisy sensor data from different devices?
A: IoT Query currently provides access to a Raw data layer, which contains complete telematics and business datasets with minimal transformation. According to the Navixy Documentation, the Transformation layer for cleansed and transformed data, as well as the Insight layer for business-ready aggregates, are planned but not yet generally available. That means integrators currently work primarily with raw source data and should account for normalization and cleaning in their own analytics logic where needed.
Q: What happens when telemetry data is delayed or missing?
A: Data availability depends on device connectivity and reporting behavior. IoT Query reflects the data received by the platform, so integrators should design dashboards and logic to handle gaps, delays, and incomplete datasets.
Q: What are the practical limits or considerations when using IoT Query for large-scale deployments?
A: Performance depends on query design, data volume, and time ranges. While IoT Query removes the need for custom storage infrastructure, integrators should evaluate query efficiency, response times for large datasets, and how frequently dashboards refresh under real-world load.
Q: How does IoT Query integrate with external systems or BI tools?
A: IoT Query supports SQL-based access compatible with PostgreSQL, allowing integration with external analytics tools and custom applications that can connect to relational databases.
Q: How are access control and multi-tenant data isolation handled?
A: IoT Query follows the platform’s organizational structure, ensuring users can only access and query data available within their account and assigned permissions.
On this page
- The operational reality of specialized monitoring
- The challenge: balancing independence with integration
- Architectural decision: why direct data access outperformed the API approach
- Implementation: from database access to operational dashboards
- What comes next: from monitoring to prediction
- The case for a data-first approach
- Frequently Asked Questions