Device and vehicle health check functionality. The Logic node in IoT Logic

AuthorSvyatoslav I., Product Manager, Navixy IoT Logic
Telematics data offers plenty of opportunities to optimize and automate your business operations, but it’s all about using the right tools. In this article, we’ll show you how to use the new Logic Node in IoT Logic to improve fleet health monitoring, automate device and vehicle health checks, and create tailored workflows that help reduce downtime and improve operational efficiency.
Automated decisions and custom business logic
Telematics has evolved beyond simple data collection to become an engine for automation and decision-making in real time. Across industries, fleet operators and integrators are demanding more flexibility to create customized automation logic. Common use cases include sending alerts when multiple conditions are met, blocking a vehicle’s engine when it exceeds set parameters, forwarding data only when specific conditions are met, etc.
These challenges require dynamic logic and customizable actions to enhance efficiency and reliability.
To address these needs, we’re introducing three powerful automation tools in the upcoming releases of IoT Logic:
- the Schedule node to define when flows should run,
- the Logic node to set conditions for triggering actions,
- and the Action node to execute those actions once conditions are met.
Today, we’re introducing the first and most fundamental one — the Logic node. What is it, and how can you use it? Let’s figure it out!
Want to know more about IoT Logic? Reach out for a quick demo or get started with Navixy to explore yourself!
What is the Logic node?
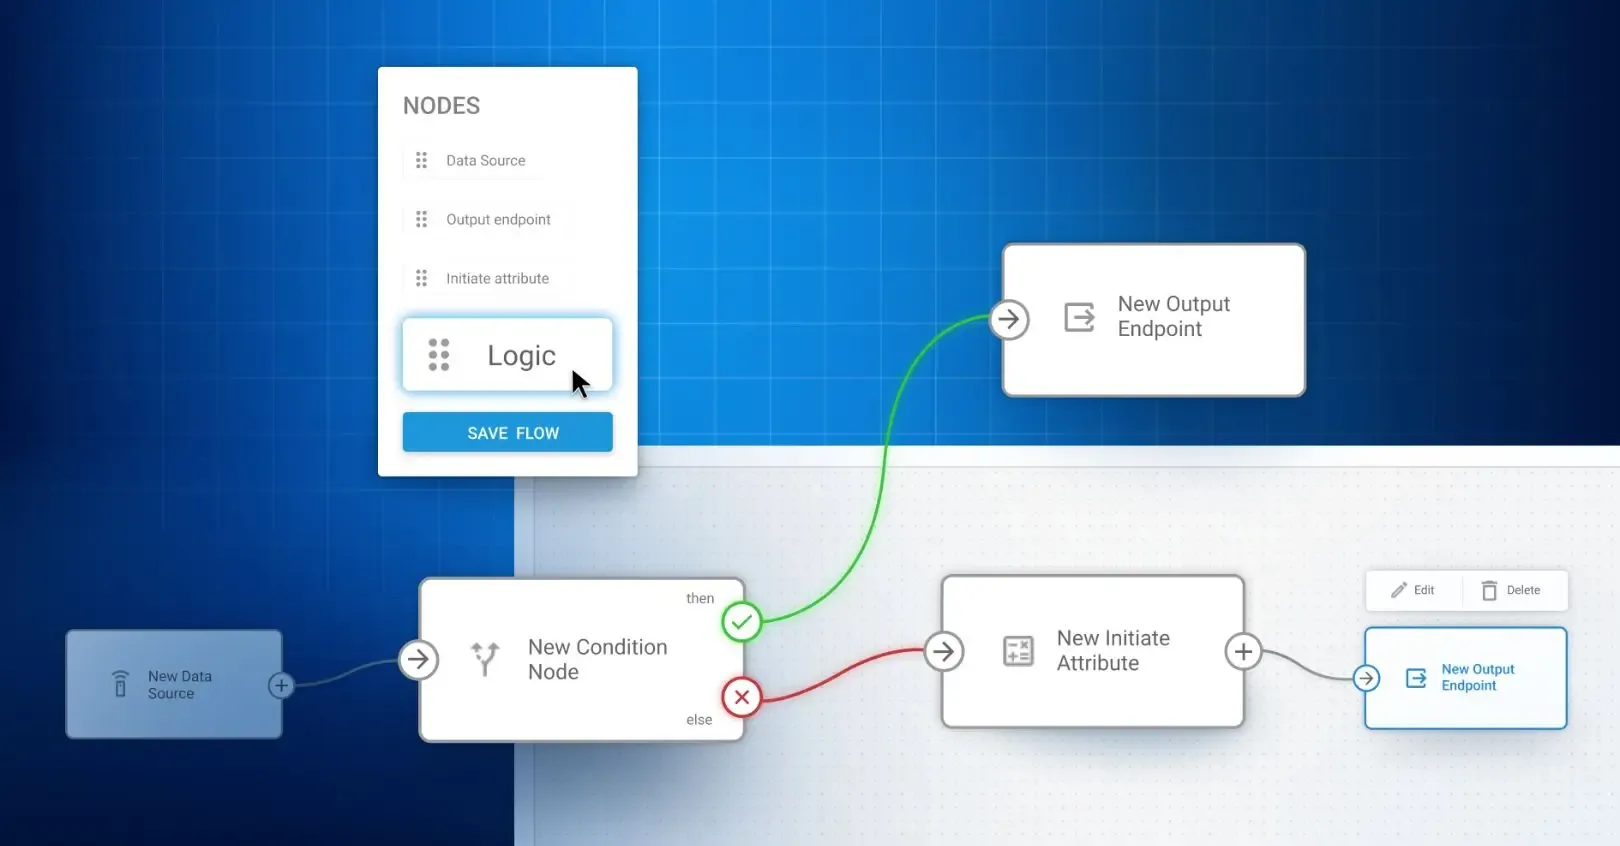
The Logic node is a new element in IoT Logic, our solution for creating custom data flows from telematics devices. It allows you to evaluate incoming data using simple if–else logic, enabling real-time decision-making. Powered by JEXL (Java Expression Language), it lets you define custom conditions without writing any back-end code.
Expressions supported in the Logic node
The Logic node supports a wide variety of expressions using JEXL. You can write conditions like:
Logical operators: && (and), || (or), ! (not)
Comparison operators: ==, !=, >, <, >=, <=
Arithmetic operations: +, -, *, /, %
Parentheses for grouping conditions and building nested logic
Most importantly, you can reference any device attribute, such as location, speed, battery level, ignition state, digital inputs, CAN data, and more.
Use cases and real value for integrators
The Logic node can be applied to a wide range of telematics scenarios, offering flexibility and automation for various business needs. Here, we’ll focus on two of the most critical use cases: device health monitoring and vehicle diagnostics.
Device health. Monitor GPS tracker status automatically
For system integrators and telematics service providers, one of the most common challenges is identifying malfunctioning devices as early as possible, before they affect customers. Implementing device health monitoring allows them to gain better control over device uptime, improve customer satisfaction, and add clear value to their offerings.
The Logic node simplifies device monitoring setup with smart automation.
For example, by monitoring parameters like GPS coordinates, satellite visibility, and battery levels, you can instantly identify devices that are malfunctioning and take proactive action, such as sending alerts or flagging the device for repair. This early detection reduces support tickets, optimizes field service resources, and boosts customer satisfaction.
What can your business gain here?
- You reduce the number of support tickets by catching issues early
- You save field service resources by avoiding unnecessary site visits
- You can sell this capability as part of a premium support or SLA package
- Your platform looks smarter and more reliable during sales demos and renewals
- Clients stay longer because they trust the quality and transparency of your service
How does it work?
The Logic node allows you to monitor the operational status of all devices in the field by checking parameters such as:
- Valid GPS coordinates
- Number of visible satellites
- External power voltage
- Battery level
- Time since last update
Here is an example condition:
latitude != null && longitude != null && satellites > 5 && external_power > 11 && last_update_age < 300
If any of these values fall outside the acceptable range, you can instantly mark the device as “problematic,” notify your support team, or trigger corrective workflows.
Vehicle health check. Real-time diagnostics from CAN bus
With the Logic node, you can monitor critical vehicle diagnostics in real time, enabling you to detect and address potential engine issues, overheating, or performance dips before they lead to expensive repairs or downtime. The flexibility to set custom conditions means you can tailor alerts to your fleet's unique needs, whether it’s for heavy trucks, equipment, or passenger vehicles.
- You can sell this as an add-on virtual mechanic for enterprise clients
- Fleets reduce downtime by identifying problems early
- Customers extend vehicle life by addressing wear before it leads to failure
- You build loyalty by showing clear ROI from your platform
- Optional: provide monthly health reports as a paid service
How to set it up with the Logic node?
With the Logic node, you can check key performance metrics like:
- Engine status and diagnostic codes
- Coolant temperature
- Engine RPM
- Fuel level or pressure
- Transmission errors
Here is a sample JEXL expression for detecting issues:
can_mil_on == true || can_dtc_count > 0 || coolant_temp > 100 || engine_rpm > 5000
This condition detects engine warning lights, active DTCs, overheating, or unusually high RPMs. When triggered, you can notify a fleet manager, flag the vehicle in your dashboard, or send a webhook to a third-party maintenance platform.
So, you see, how easily vehicle health monitoring, on top of being a technical benefit, becomes a business tool that clients can rely on for compliance, cost savings, and operational efficiency.
Get started today
The Logic node gives you the power to customize conditions on any telemetry data, set up smarter alerts, and automate real-time decisions. This enables you to offer proactive diagnostics, enhance your service offerings, and unlock new revenue opportunities for your business.
Ready to take your automation to the next level? Jump into the Logic node today and start building smarter, more efficient workflows for your clients. Contact our team to guide you every step of the way as you explore the full potential of IoT Logic.
P.S. This is just the beginning. IoT Logic is becoming your go-to platform for intelligent automation, helping you run smoother operations and deliver even more value to your clients.
So stay tuned for more updates!