Decode any telematics sensor data with IoT Logic

Summary
- Most trackers already tunnel RS-232/485 bytes upstream, so you receive raw ASCII or HEX, not neatly parsed values.
- IoT Logic turns that raw stream into usable metrics with a visual flow, you decode in Initiate Attribute (JEXL and bitwise), keep a 12-reading memory, branch with IF/THEN, and fan out results, no custom backend.
- The Data Stream Analyzer makes troubleshooting painless, you watch raw payloads and computed fields in real time, and you always see the last 12 valid values like an X ray.
- In practice it feels plug and play, parse Technoton key values via Teltonika, lift driver IDs from Queclink tunnels, decode Concox 0x9B frames, pull RPMs and headcounts from Digital Matter or Streamax, then trigger alerts, immobilize, or flip relays.
- Reuse simple expressions, bit masks, current versus previous deltas, and time aware checks with srvTime or genTime, so you debounce noise, spot trends, stay vendor agnostic, and ship sensor dashboards without new backend projects.
Picture this. Your tracker is online and reporting smoothly, but the oddball sensor wired into its RS-232 port — a fuel probe, an RFID reader, maybe even a passenger counter — doesn’t speak the same language as your cloud application. Instead, it just spits out raw frames: 79 79 … 9B … 0D 0A or a cryptic line like can_tot_fuel_used=2076.4139.
The GPS device, dashcam, or MDVR doesn’t try to make sense of it. It simply acts as a gateway, wrapping those raw bytes and firing them off to the cloud untouched. That flexibility is great for connecting rare or niche sensors, but it can feel daunting when a customer expects polished dashboards and alerts the very same day.
This is exactly the world Navixy’s IoT Logic was built for. It lets you grab those bytes, peel off bits and fields with a simple, visual flow, reuse JEXL-based expressions (yes, including bitwise), reason over the last 12 readings, branch with IF/THEN, and either display, forward, or even send commands back to devices without the need for custom backend.
First, a quick reality check: most trackers already forward raw sensor data
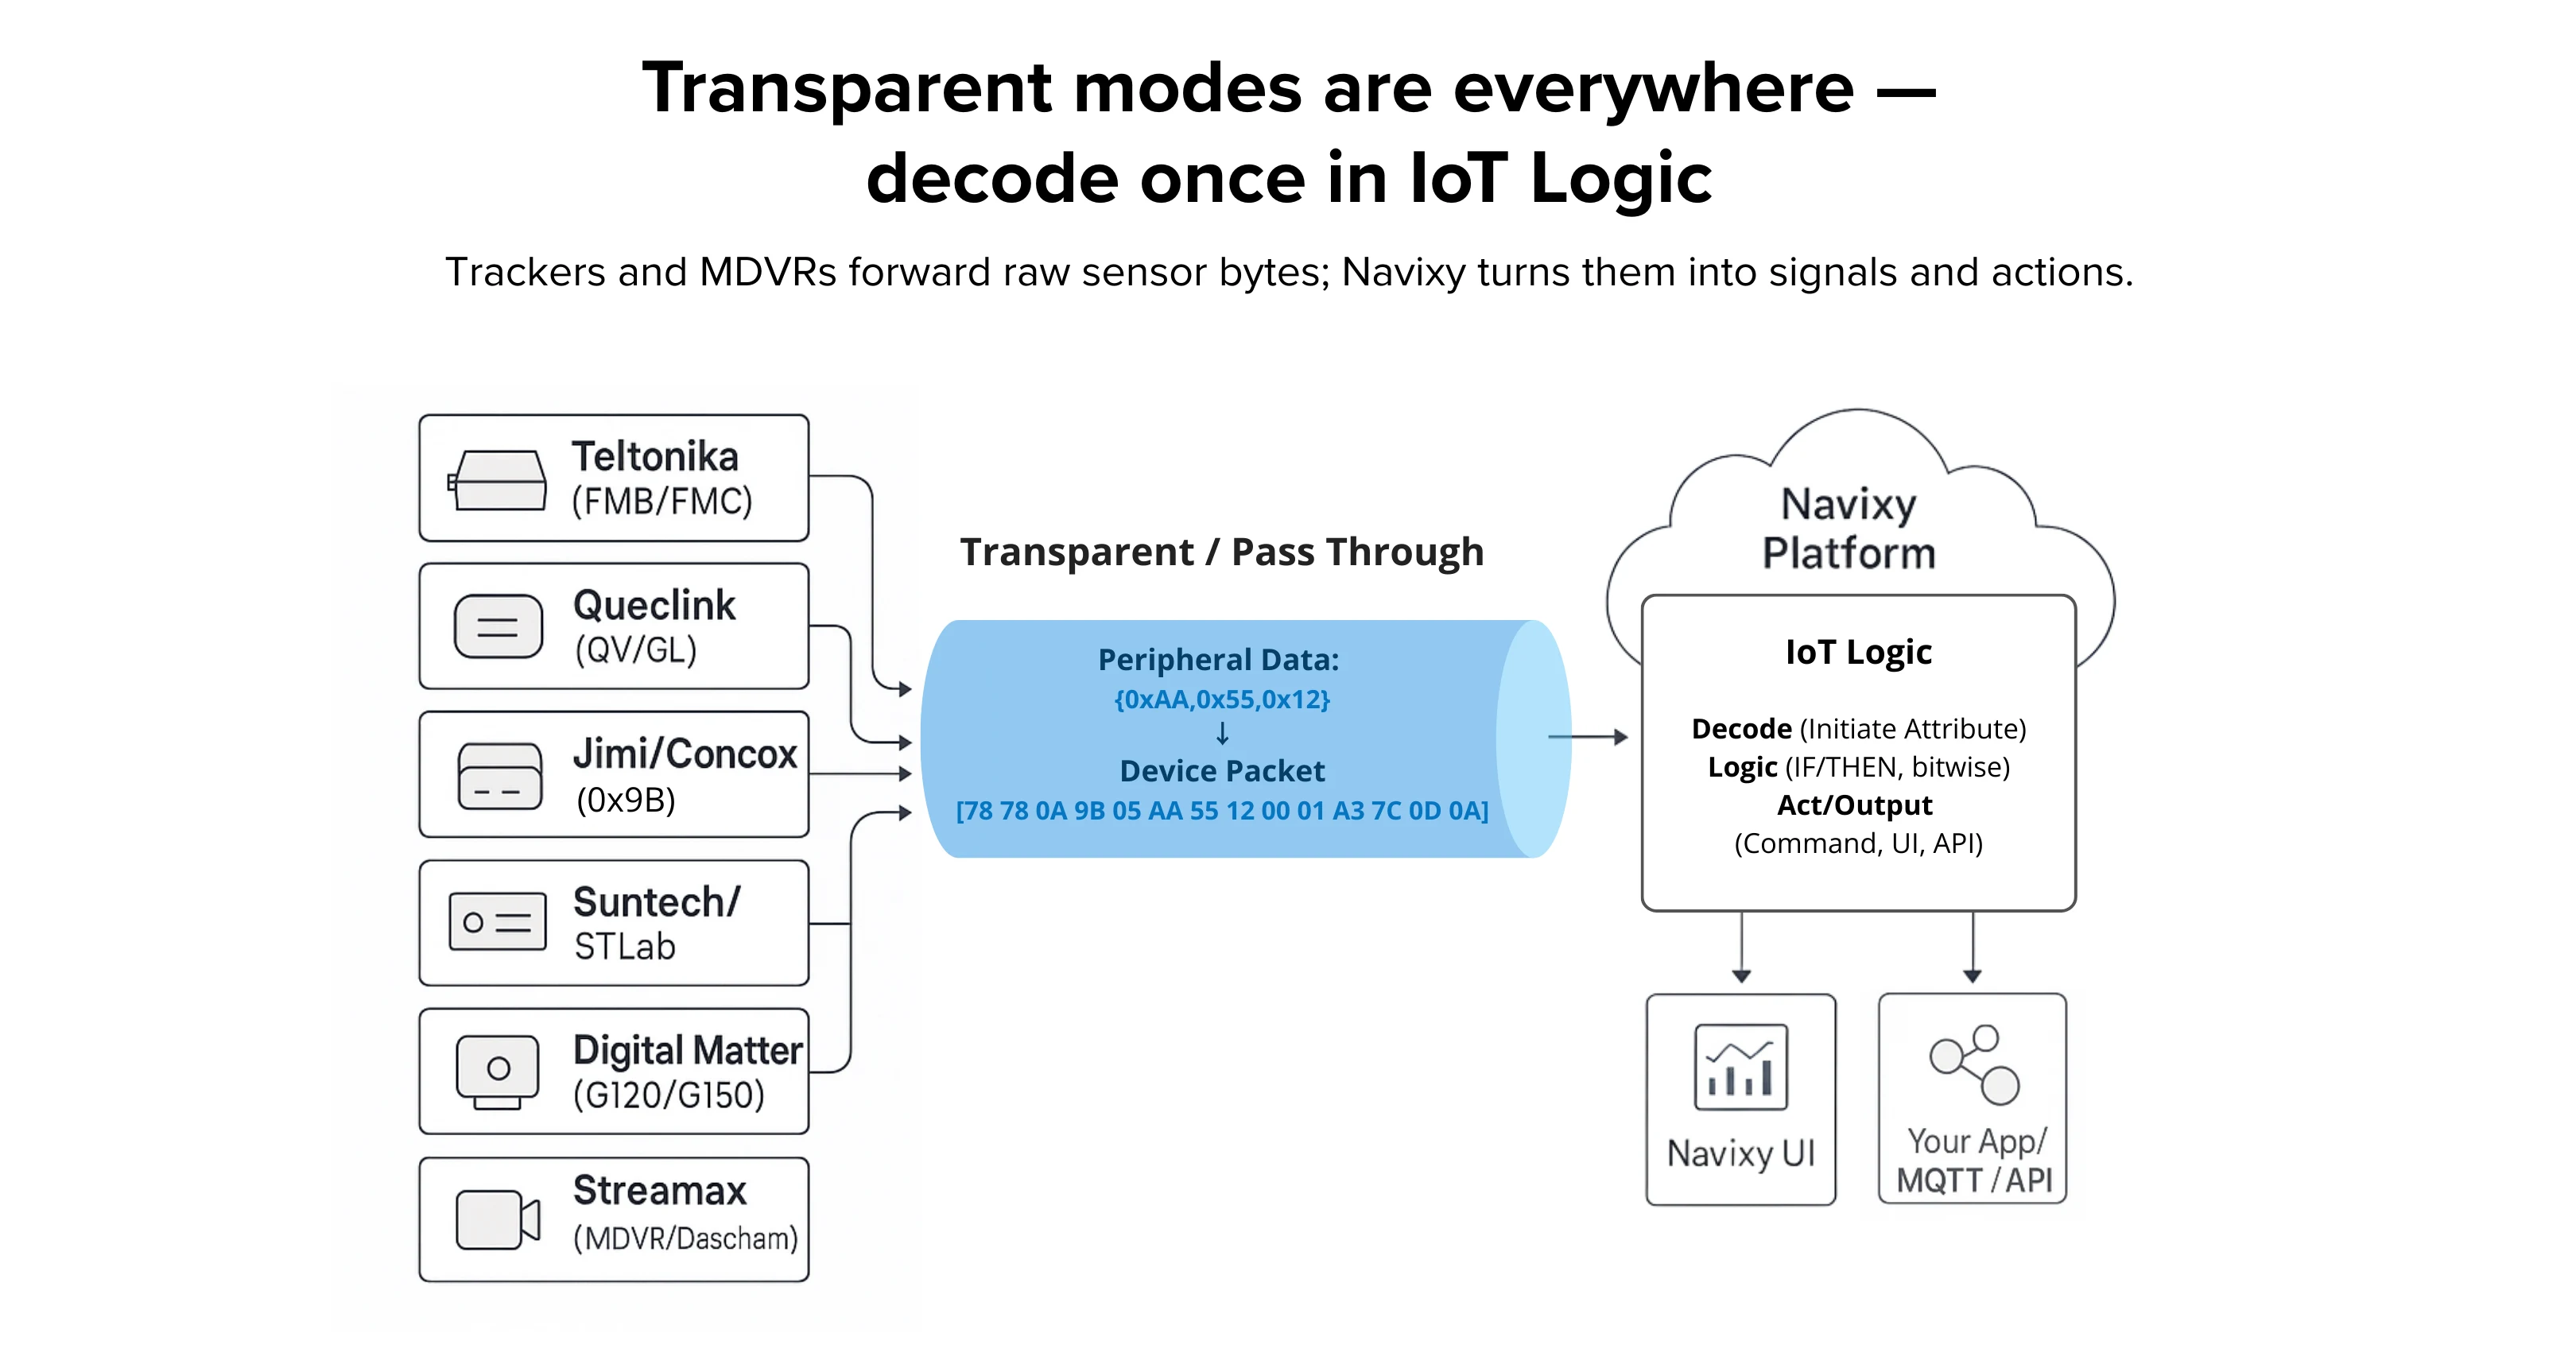
Across the industry, “transparent” or “pass-through” modes are everywhere:
Teltonika (FMB/FMC): set RS-232/485 to TCP ASCII/Binary and everything the peripheral sends goes straight to your server, encapsulated as Codec 12; buffered uploads — and when a timestamp option is enabled — use Codec 13. ASCII waits for <CR><LF>; Binary ships after ~30 ms of silence. No on-device parsing.
Queclink (GV/GL): the @Track protocol includes +RESP:GTDAT for ASCII serial tunneling; you can also downlink with AT+GTDAT. For binary/hex serial payloads, vendors often use the GTDTT report.
Jimi/Concox: the 0x9B “Transparent Transmission” packet wraps RS-232 data (ASCII/HEX) with a tiny header/CRC so the server can decode it.
Ruptela: the Transparent Channel uses Command 14/114 to move raw serial bytes up/down. It even time-stamps when data arrives on the RS-232 side.
Suntech/STLab: ST300 family reports include user RS-232 data fields (hundreds of bytes per message) — forwarded to the platform.
Digital Matter (G120/G150): explicit RS-232 Passthrough mode; BLE gateways forward tag/sensor data.
Streamax (MDVR/dashcams): MDVRs expose RS-232/RS-485 for peripherals (passenger counters, LED signs, etc.), forwarding events/values along with video telemetry.
How IoT Logic makes “serial spaghetti” digestible
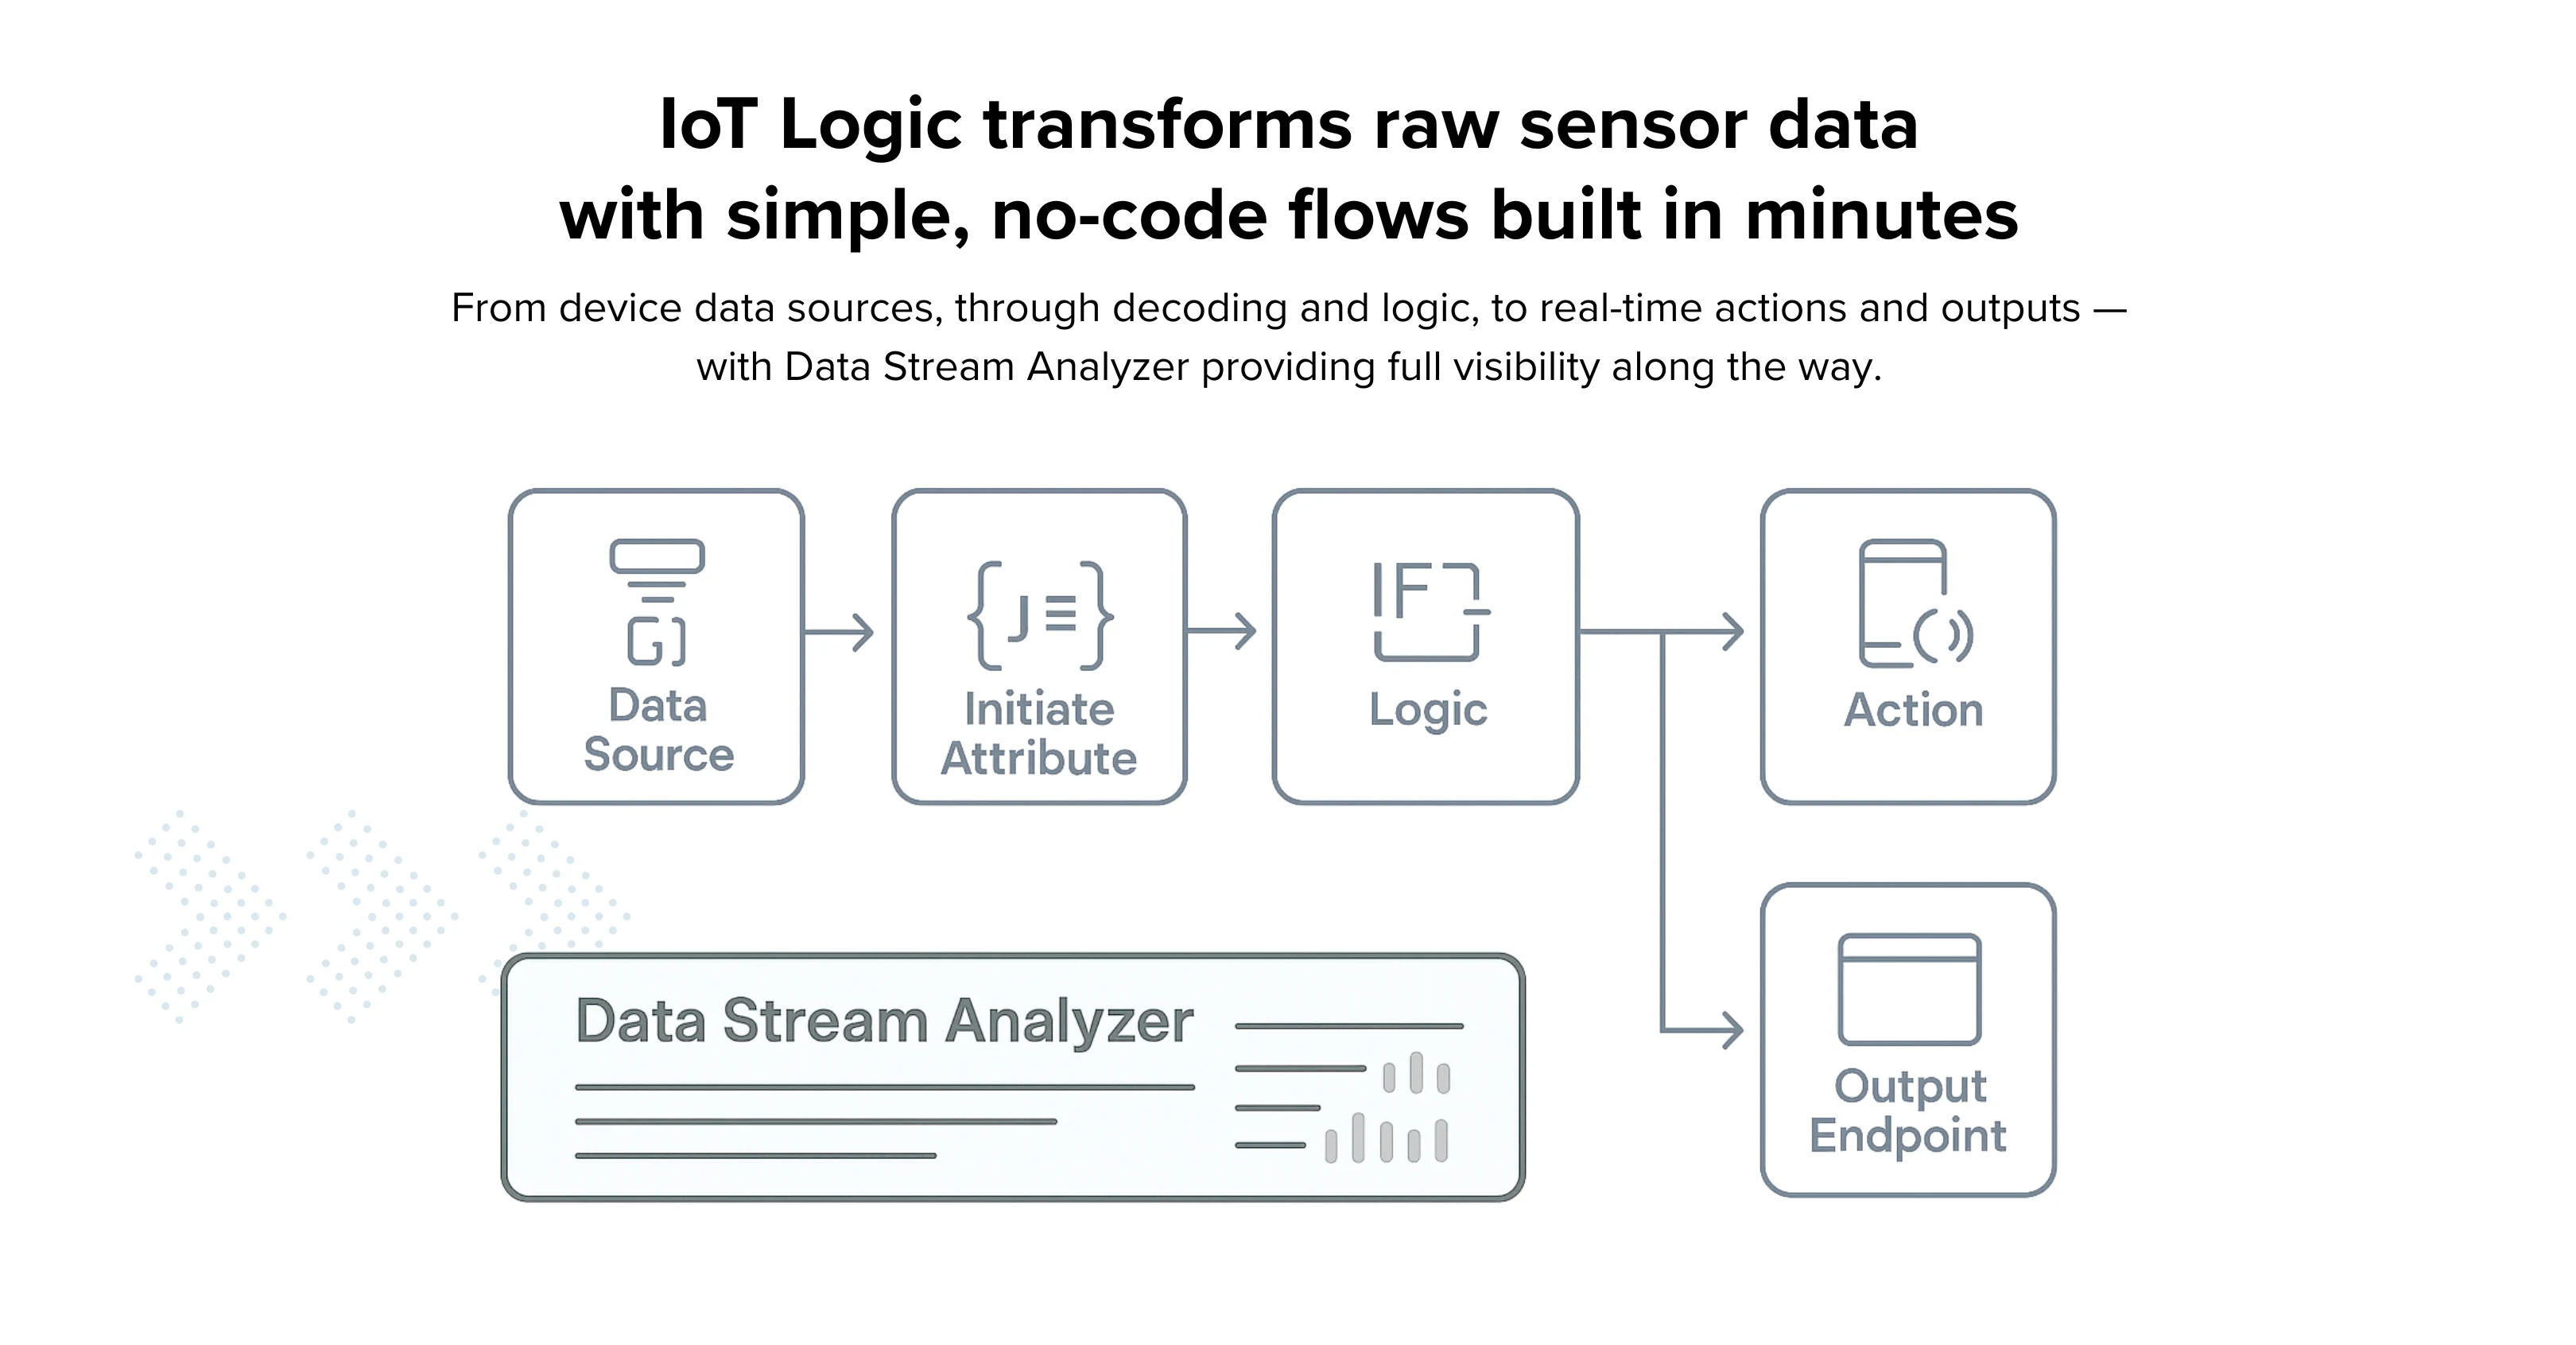
IoT Logic gives you a drag-and-drop pipeline:
You decode, enrich, and route — all in one place.
Initiate Attribute is your decoder block. You create named attributes and transform raw payloads with the Navixy Expression Language (JEXL-based), from string splits to math to bitwise masks.
Another killer feature here: IoT Logic stores the current value and up to 12 previous values per parameter. In an expression, value('sensor', N, 'valid') lets you fetch "now" (index 0) or step back through 12 slots of clean, valid history. You can also ask for the device (gen) or server time for each value with genTime() / srvTime(). That means debouncing, delta checks, and trend logic are trivial without a database.
When you want to decide, the Logic node evaluates a boolean expression and splits the flow (IF/THEN). And when it’s time to do something, the Action node can send commands back to devices or ping external systems. To distribute results, the Output Endpoint node fans out to Navixy UI and/or your own apps/services in parallel.
For live troubleshooting, Data Stream Analyzer shows raw device input and your computed attributes as they flow, with those last 12 values visible at a glance. It’s an X-ray for your pipeline.
What it feels like in practice (four quick stories)
1) Teltonika + Technoton CAN adapter: text in, metrics out
A Technoton adapter on RS-232 streams ASCII data in key-value pairs:
can_ign=1;can_speed=54; can_tot_fuel_used=2076.4139
In Teltonika’s TCP ASCII mode the tracker forwards each line after <CR><LF> straight to the server as Codec 12/13. IoT Logic’s Initiate Attribute parses the pairs, saves can_speed as a number, and logs a rate-of-change for fuel_used using the previous valid value at index 1. If speed > 0 while a “door open” bit is set, the Logic node raises an alert; if a rapid fuel drop is detected while ignition is off, Action can flip a relay or send a command.
2) Queclink GTDAT (ASCII) and GTDTT (HEX): driver IDs and more
Queclink's +RESP:GTDAT report is literally a serial text tunnel; the server can downlink AT+GTDAT to talk back to the peripheral. For binary payloads, GTDTT carries hex. In IoT Logic you split or hex-decode once, then keep fields like driver_id as first-class attributes. From there it's easy: if the card ID isn't on your whitelist, branch to "unauthorized" and Action an immobilize command.
3) Concox 0x9B: hex frames that “just work”
Concox trackers wrap peripheral bytes in 0x9B packets. Example packet structure:
79 79 … 9B 03 … 02 31 42 30 30 31 33 46 37 37 37 38 38 03 … 0D 0A
Those inner bytes decode to an RFID string; IoT Logic stores it, compares to the previous value (index 1) to filter duplicates, and only emits changes. If it’s a fuel probe instead, we map bytes to liters, smooth with the 12-value window, and publish.
The official “transparent transmission” definition for 0x9B is public too, if you want the on-wire details.
4) Digital Matter and Streamax: RPMs and headcounts without extra code
Digital Matter’s G120/G150 support RS-232 Passthrough; the Dingtek DZ300 drum sensor, for instance, reports barrel RPM (+/– indicates direction). You lift it into an attribute, then branch on PTO status to catch cement left idling.
For people-moving, Streamax MDVRs carry counters over RS-232/RS-485; IoT Logic merges “IN/OUT” with a BLE temperature tag and toggles an auxiliary fan if the cabin’s overcrowded and hot.
A few expression tricks you’ll reuse a lot
Bit flags in masks
Got a bundle of OBD/CAN status bits or door sensor flags? You can peel off just the one you care about:
(value('status_flags', 0, 'valid') & 0x10) != 0
That checks if bit 4 is set and routes only when it’s true.
Current vs. previous value
Need to catch sudden spikes or drops? Compare the latest reading to the one before it:
value('fuel_l', 0, 'valid') - value('fuel_l', 1, 'valid')
Throw in a threshold and you’ve got instant debouncing or fuel slosh filtering – without SQL gymnastics.
Time-aware rules
Sometimes it’s not just the value, but how long it stays there. Example: raise an alert if the temperature’s been over 26°C for three minutes:
srvTime('temp', 0, 'valid') - srvTime('temp', 1, 'valid') > 180000
  && value('temp', 0, 'valid') > 26
Your flows stay clean and readable because the Logic node only needs a yes/no. The Initiate Attribute node does the heavy lifting (renaming, scaling, masking), and the Action node decides what to do next: flip a relay, update the UI, or push the event to MQTT or your app.
Why teams ship faster (and argue less with finance)
With IoT Logic, you don’t need to spin up a new backend service every time a new sensor shows up in the field. You decode once in Initiate Attribute, reuse it across devices, and stay vendor-agnostic – whether the data came from Teltonika, Ruptela, Concox, a dashcam, or a BLE tag.
At the same time, the Data Stream Analyzer gives you instant visibility into raw and processed values, while outputs go in parallel to Navixy dashboards and your own systems. Less custom code, fewer support headaches, and no budget battles over “just one more sensor.”
Ready to turn raw bytes into clear metrics you can act on? Let us map your stream to outcomes, then contact our Sales to plan the rollout.