Dashboard Studio: get custom fleet analytics in less than a minute

AuthorKirill E., Navixy Data Analyst
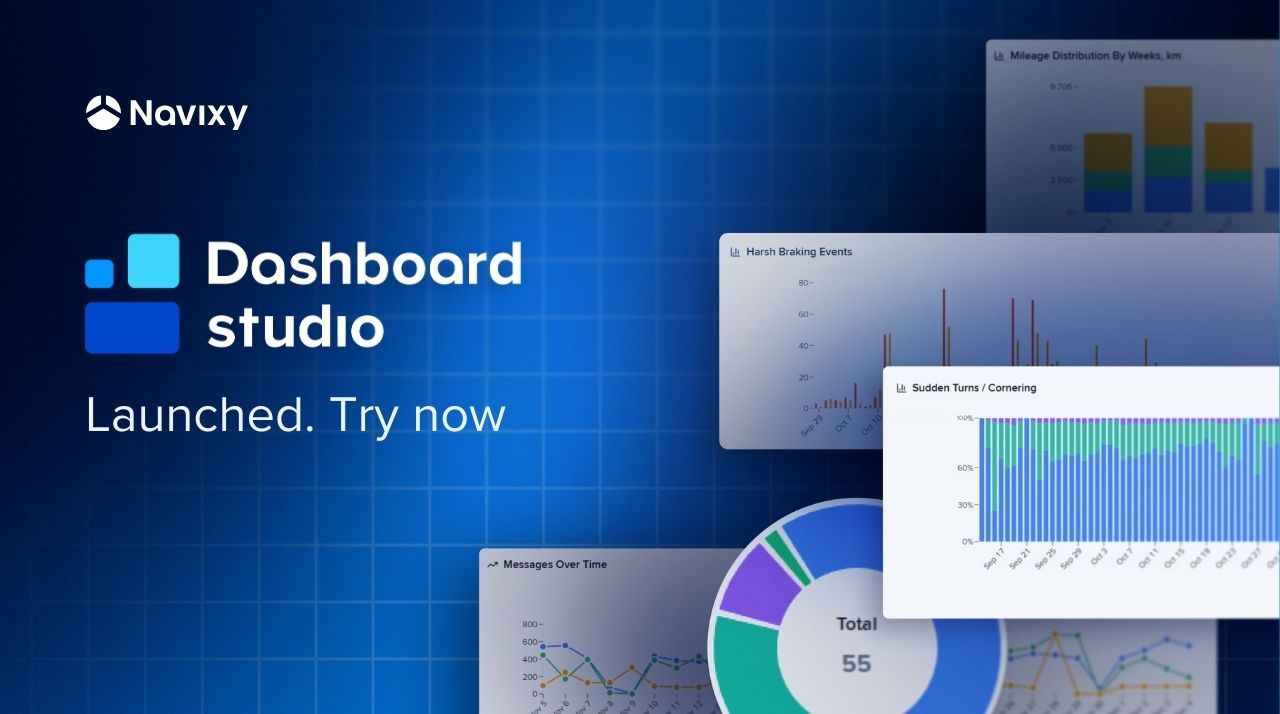
Navixy introduces Dashboard Studio, an embedded data visualization tool that lets fleet teams create custom panels for their specific workflows and KPIs without external services or BI projects. A lightweight analytical layer can be embedded smoothly into the platform. Are you ready to unlock advanced analytics in under a minute? Read the full story for the details.
Key takeaways
• Build custom fleet dashboards in a few clicks, directly inside Navixy without additional BI tools.
• Give partners and end users a live “performance command center” instead of static Excel packs.
• Start with templates, then adapt KPIs, layouts, and filters to your own contracts and regions.
• Use Navixy Dashboard Studio as the first step toward full IoT Query-based analytics and reporting.
Why did Navixy create Dashboard Studio?
Navixy already provides rich telematics data and standard reports. What is often missing is a systematic way for each customer to turn that data into their own decision center: a configurable dashboard that matches their specifics.
Meanwhile, the pressure is rising:
- Leadership demands reductions in fuel, emissions, accidents, and downtime.
- Partners need to differentiate beyond “map + alerts” to keep customers engaged.
- Analysts spend hours rebuilding the same dashboards every week.
This is the moment when Navixy customers ask: “Can we get custom analytics without starting a BI project?” That is exactly the question Dashboard Studio answers. It gives Navixy users a fleet-ready analytics layer directly on top of Navixy IoT Query, without standing up separate BI infrastructure or hiring a dedicated BI team.
Contact Sales to learn more about how Navixy can enhance your decision-making process with advanced fleet analytics.
What is the Navixy Dashboard Studio?
Dashboard Studio works with the structured datasets already available in Navixy IoT Query, the same lakehouse architecture that enterprise fleets use for BI, ML, and integrations, and brings them into a visual, governed, easy-to-assemble workspace inside Navixy.
- SQL-native dashboards based on unified IoT Query datasets (for teams that prefer direct query control).
- Intuitive visual exploration for users who want to build dashboards by themselves.
- Direct embedding into the existing Navixy interface, so users stay in the same place where they already work with telematics data.
There is no need for external infrastructure to deploy, additional licenses, staff, or standalone BI environment to govern. Dashboard Studio extends Navixy and adds flexibility without asking your organization to run a BI team or deploy additional tools.
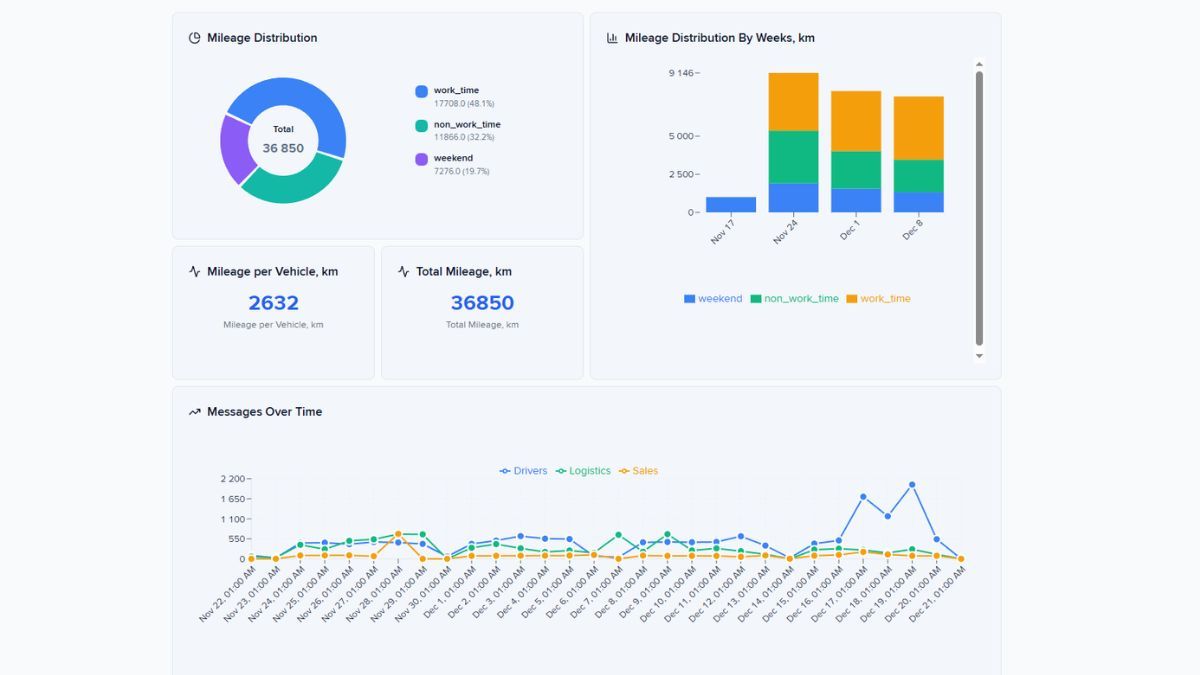
Navixy Dashboard Studio capabilities
- Configurable dashboards: choose charts, KPI tiles, layouts, and filters that match your fleet workflows.
- Governed self-service: power users define metrics and dashboards once; business users can rearrange and explore safely.
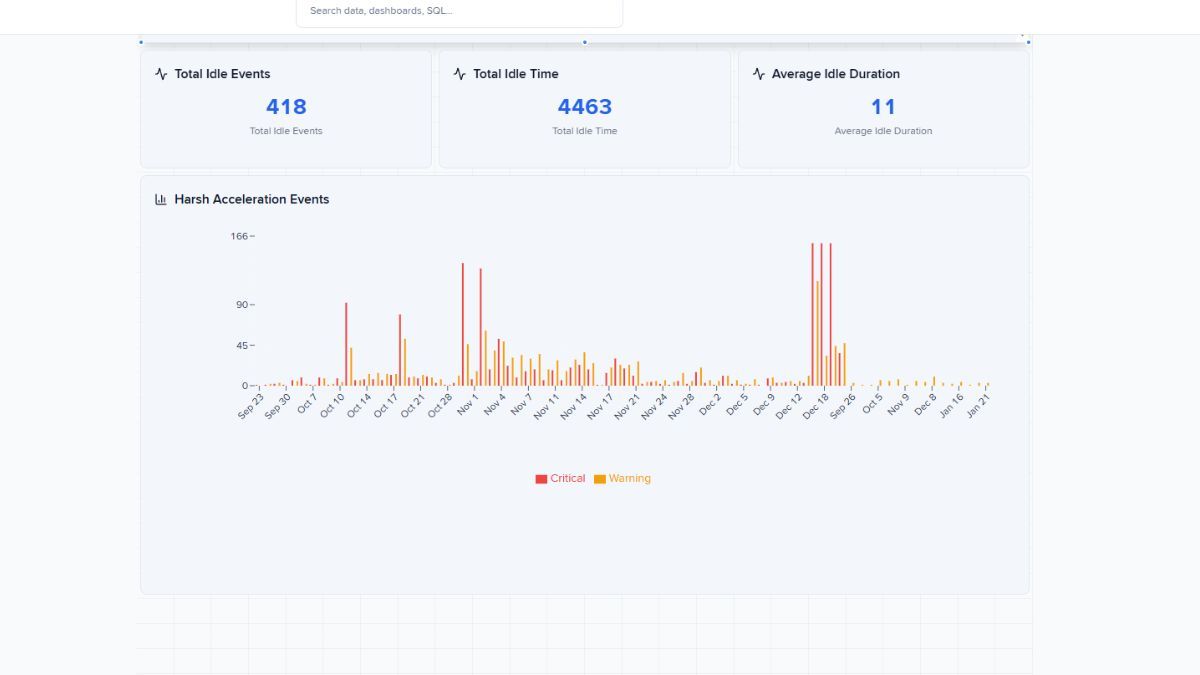
- Real operational clarity: build panels that highlight cost drivers, safety trends, utilization gaps, delays, and SLA breaches.
- Embedded experience: dashboards live inside Navixy and partner portals, so there is no context switching.
- Template-ready: start from Navixy templates for fuel, maintenance, geospatial movement, and safety performance.
- IoT Query-ready foundation: for advanced teams, dashboards can sit directly on your dataset, bringing SQL-defined KPIs into the visual layer. * Export and import functionality: share dashboards and reports with with key stakeholders.
Dashboard Studio becomes the “analytics layer” your fleet or your customers use every day — a controlled, embedded space that sits right on top of Navixy data.
NOTE: Dashboard Studio is an open-source application. That means that if you need and have resources, you can create own fleet performance analytics application on the foundation of Navixy Dashboard. The code is available on its GitHub page.
The fleet analytics tool clients have been asking for
Fleet teams and partners often describe the same gap: they have the data, but not a straightforward way to shape it into the performance views that actually guide day-to-day decisions. Navixy Dashboard Studio steps into that gap by supporting the core management jobs that define how fleets run operations and how TSPs deliver value to their customers.
The performance center
Fleet leaders want one place to see where they are winning and losing — today, not next month. They need fuel stability, safety signals, SLA risks, utilization patterns, maintenance exposure. Dashboard Studio surfaces all of this using real-time and historical IoT Query datasets.
Customer-facing reporting for TSPs and integrators
If you sell telematics solutions, credible, branded analytics in your portal are essential. Otherwise, you face constant custom reporting or the risk of customers switching to vendors with more advanced performance views. This tool enables experienced partners to package their expertise into dashboards and value-added services for end users.
Scalable analytics capacity
Operations teams should not be a reporting factory. With Dashboard Studio, power users define KPIs once; business users explore them safely without breaking formulas or running heavy queries.
How does Dashboard Studio work?
Before teams begin assembling dashboards, it helps to understand the foundation that makes the experience both flexible and predictable
- Activate IoT Query and enable Dashboard Studio inside Navixy workspace. All telemetry, fleet, driver, sensor, and task data is already organized in IoT Query’s medallion architecture. Dashboards stay consistent across the business.
- Build dashboards in minutes. Drag tiles, apply filters, choose time windows — create your first dashboard without needing a specialist. Use the preloaded templates, it’s easy to start, test hypotheses, and monitor the state of your operations.
- Define metrics once. Power users create KPIs; operators explore them without risk. Use the Navixy SQL Recipe Book for ready-made query patterns. Edit query using any LLM service.
- Embed and export dashboards. Publish dashboards into the Navixy interface or partner portals. Export/import templates for rapid customer deployment.
- Extend through Navixy IoT Query. Advanced teams can use SQL-defined KPIs, near-real-time streams, and cross-entity joins across telematics and business data. Dashboards consume these enriched metrics seamlessly.
Take a next step: turn your Navixy fleet data into decisions
If you already use Navixy, you do not need new tools, infrastructure, or a full BI initiative to improve analytics. For many customers, Dashboard Studio is the ideal starting point to advanced fleet analytics. With the tool you can provide to your clients immediate value without integration overhead, while keeping the door open for advanced analytics, BI, or ML use cases later.
Use Dashboard Studio as your first step into custom analytics. Contact Sales to enable Navixy IoT Query and activate Dashboard Studio.